FIGURE 10.
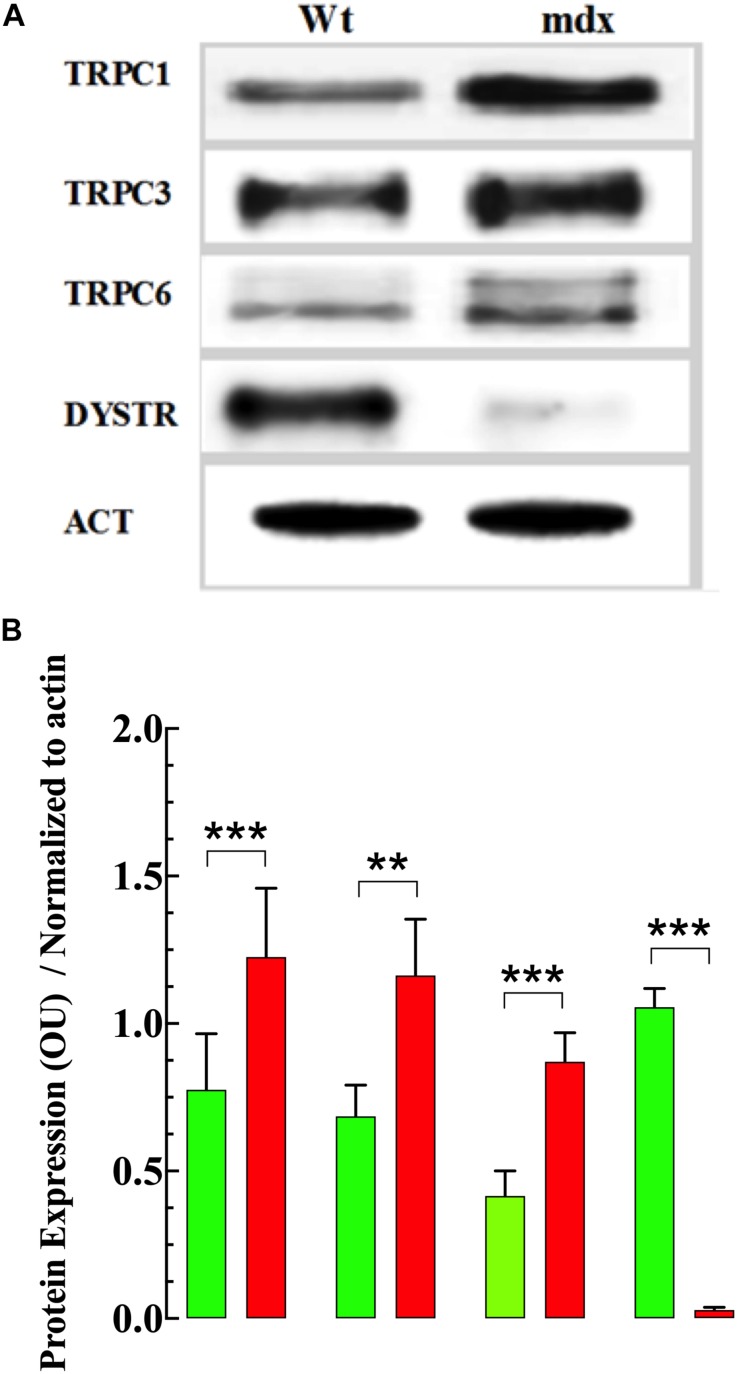
Expression of TRPC isoforms. Figure 10. Expression of TRPC isoforms. Representative fluorescent Western blot analysis of the expression of TRPC1, TRPC3, TRPC6, and dystrophin (DYSTR) proteins in Wt and mdx VSMCs (A). Densitometric analysis of individual experiment fluorescent Western blots shown in (B). Data were normalized to actin and expressed as mean optical unit values ± S.D. nmice = 3. Paired t-test, **p ≤ 0.01, ***p ≤ 0.001.

