FIGURE 3.
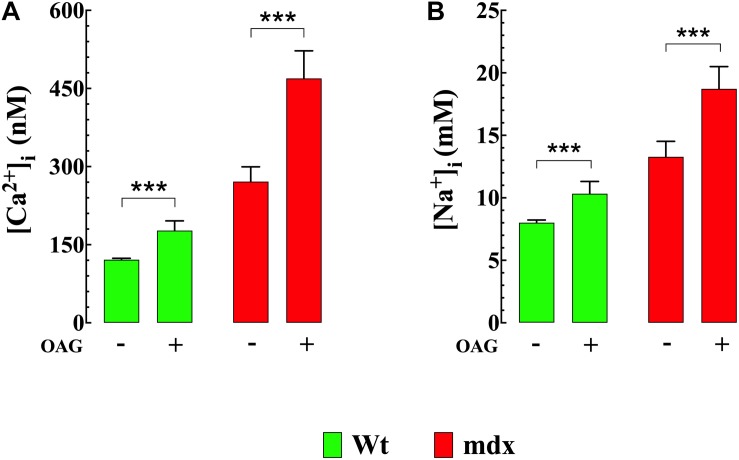
OAG induces elevation of [Ca2+]i and [Na+]i. Exposure of quiescent Wt and mdx VSMc to 1-oleoyl-2-acetyl-sn-glycerol (OAG) 100 μM induced a significant elevation of [Ca2+]i (A) and [Na+]i (B), which were greater in mdx than Wt muscle cells. Over the horizontal axis are indicated the experimental conditions used to measure [Ca2+]i and [Na+]i. For [Ca2+]i measurements: nmice = 4/experimental condition, ncell = 21–27/genotype. For [Na+]i measurements: nmice = 3/experimental condition, ncell = 23–25/genotype. Values are expressed as means ± S.D. for each condition. Student’s t-test ***p ≤ 0.001.

