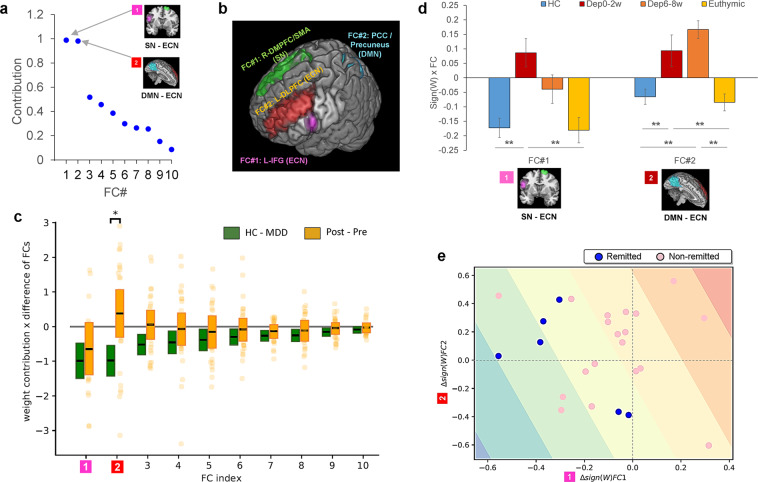
Figure 3.
Individual functional connection changes from before to after antidepressant treatments. (a) Contribution of each of 10 FCs to the melancholic depression classifier. (b) Top two FCs with dominant contributions. There was a partially-overlapped region of both FCs in the left DLPFC. (The rendering tool: MRIcroGL 64-bit 12 June 2015, https://www.nitrc.org/projects/mricrogl) (c) For each FC, the post minus pre antidepressant treatment difference in average FC values of melancholic MDD (Post and Pre, n = 25) was compared with that difference between healthy control (HC, n = 65) and melancholic MDD (MDD, n = 65), and only the FC#2 showed significant difference (p < 0.05). The box plot represents the 95% confidence interval around the mean. (d) FC#1 and FC#2 changes with the antidepressant treatment were examined. The bar graphs represent mean values with standard error (SE) bars. Compared to healthy control (HC, n = 65), pre-treatment (Dep0–2w, n = 25), post-treatment (Dep6–8w, n = 25), and an independent cohort of remitted depression patients (Euthymic, n = 34). (e) Changes in FC#1 and FC#2 for the 25 melancholic MDD patients with antidepressant treatments (blue dots: remit, n = 6, and pink dots: non-remit, n = 19). The blue to red gradient represents the probabilistic decision boundary of the logistic regression, where stronger blue (remit) and red (non-remit) colors are associated with a large probability of being in class and weaker colors represent increased uncertainty. *p < 0.05, **p < 0.01.

