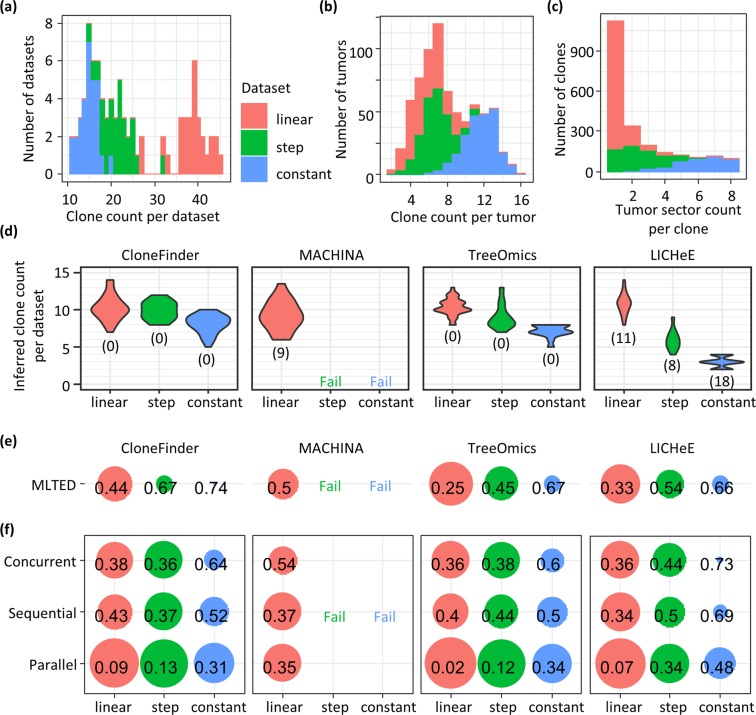
Figure 8.
Accuracy of inferred clone phylogenies for TG datasets (linear, step, and constant). (a) The total number of clones in a dataset. (b) The total number of clones within a tumor sector (sample). (c) The number of tumor sectors that had a clone, which showed the degree of clone sharing among tumor samples. (d) The total number of inferred clones for a dataset. The number in parenthesis is the number of datasets that a method failed to produce a result. (e) The average MLTED score. A smaller value is better. (f) Error rates of ordering mutations.

