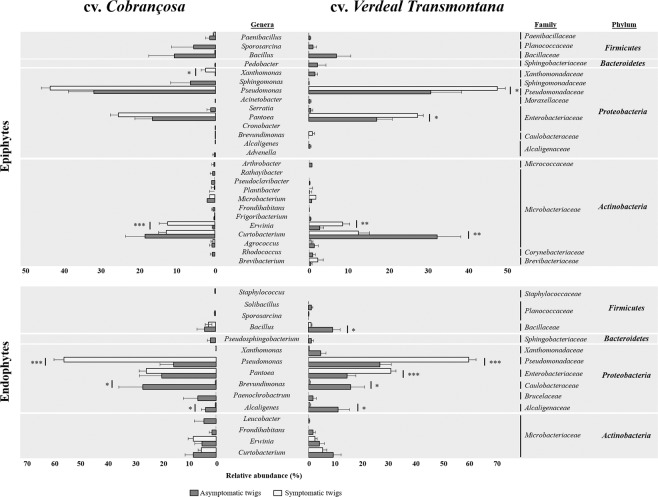
Figure 3.
Comparison of the relative abundance of bacterial epiphytes and endophytes, between asymptomatic and OK-symptomatic twigs of olive trees from cvs. Cobrançosa and Verdeal Transmontana. Comparisons are made considering different taxonomic levels (genus, family and phylum). Each value is expressed as mean ± standard error (n = 14, corresponding to 2 olive orchards × 7 trees). Statistically differences between pairs of values are showed by asterisks (*p < 0.05; **p < 0.01; ***p < 0.001).

