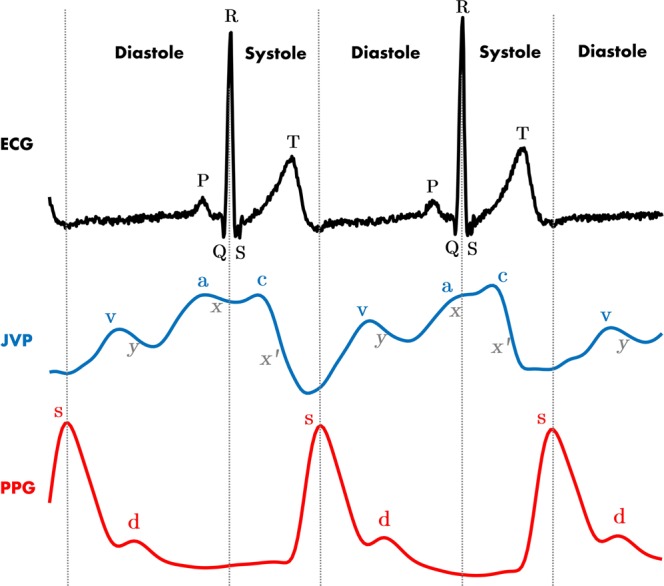
Figure 1.

ECG, JVP and PPG signals traces. Dashed vertical lines separate the two phases of the cardiac cycle: systole and diastole. Each physiological signal is annotated with the corresponding significant waves. For ECG: P corresponds to atrial depolarization, QRS complex to ventricular depolarization and T to ventricular repolarization. For JVP: the a,c,v ascents are annotated in blue and the x, x’ and y descents in gray. For PPG: s indicates the systolic peak and d the diastolic peak.
