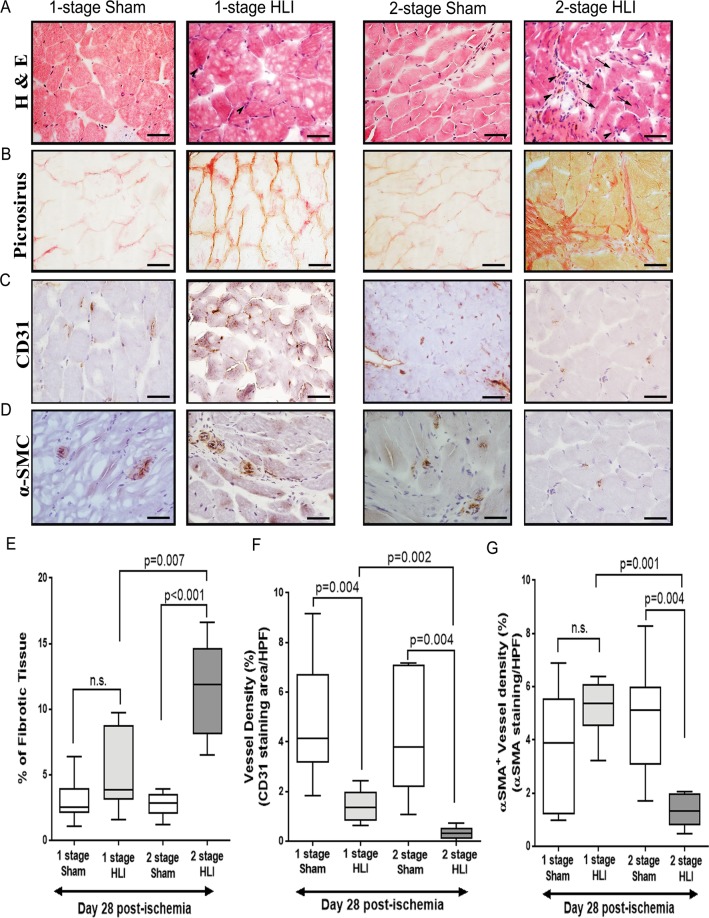
Figure 3.
The 2 stage HLI model showed increased fibrosis and reduced angiogenesis compared to the 1-stage HLI model. (A) Representative hematoloxylin and eosin (H&E) staining of gastrocnemius muscle sections from the 1-stage and 2-stage Hind limb ischemia (HLI) models and respective sham controls at day 28. Normal morphology in the gastrocnemius sections of sham controls was evidenced by intense eosin staining and the presence of peripheral nuclei. Arrows and arrowheads indicate regeneration and remodelling of muscle bundles and invasion of inflammation of inflammatory cells, respectively. Persistent inflammation is evident in samples from the 2-stage HLI model taken at day 28 (arrow heads). (B) Fibrotic changes in gastrocnemius muscle after femoral artery ligation. Representative Picrosirius red-stained histological sections showing increased fibrotic (red) content indicating significant increase of interstitial fibrosis in the ischemic limb. (C) Representative immunohistochemical images showing neovascularisation after HLI in the two models assessed by CD31-positive staining (dark brown staining). The panel shows images from the ischemic limbs from the 1-stage and 2-stage HLI models and the respective sham controls (n = 8/group). (D) Representative immunohistochemical images showing α-Smooth muscle actin (α-SMA)–positive vessel density (dark brown staining). The panel shows the data from the ischemic limbs from the 1-stage and 2-stage HLI models and the respective sham controls (n = 8/group, scale bars in all images = 25 µm). (E–G) Quantitative bar graphs showing the effect of HLI on (E) skeletal muscle fibrosis by picrosirius red staining, (F) angiogenesis by immunohistochemical staining against CD31 and (G) arteriogenesis by immunohistochemical staining against α-SMA. All values are median and interquartile ranges (n = 8/group) and p value significance set at ≤0.05.

