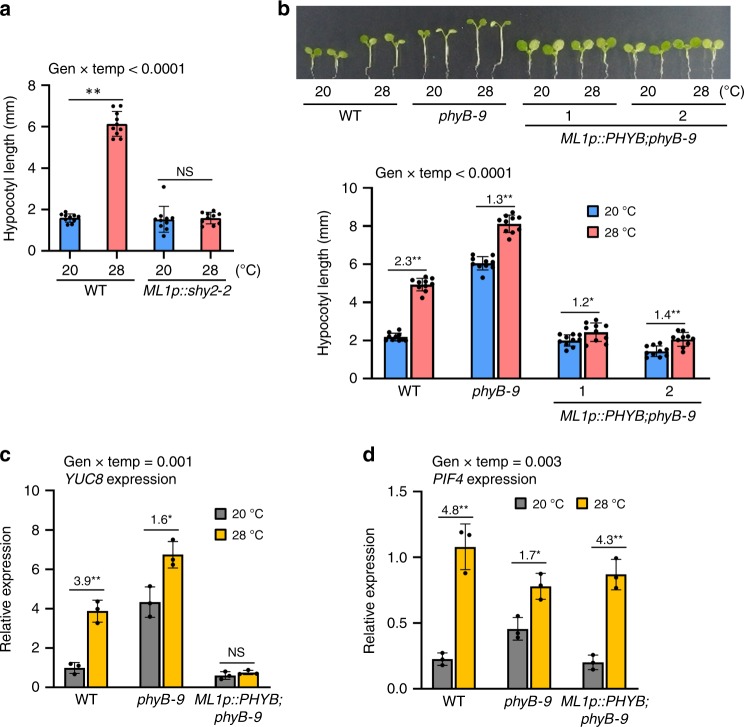
Fig. 4. Epidermal auxin and phyB regulate high temperature-induced hypocotyl growth.
a Hypocotyl lengths of the wild-type (WT) and ML1p::shy2-2 seedlings grown in the same conditions described in Fig. 3a. Error bars indicate s.d. (n = 10 plants). The P-value for the interaction term (genotype x temperature) calculated by two-way ANOVA is shown at the top. Black asterisks above the bars (in a-d) indicate significant differences (**P < 0.01 and *P < 0.05, two-tailed Student’s t-test). NS, not significant (P ≥ 0.05). b Hypocotyl lengths of WT, phyB-9, and ML1p::PHYB;phyB-9 seedlings grown in the same conditions described in a. Error bars indicate s.d. (n = 10 plants). Representative seedlings are shown in the upper panel. The numbers above the bars indicate the ratio of hypocotyl lengths of seedlings grown at two different temperatures (28 °C/20 °C). The P-value for the interaction (genotype x temperature) is shown at the top. c, d qRT-PCR analyses of YUC8 and PIF4. Seedlings were grown in 12 h light/dark cycles (12 L:12D) at 20 °C for 4 days and transferred to the continuous white light on the 5th day. The growth temperature was increased to 28 °C or kept at 20 °C for 4 h at ZT20-24 before harvesting for total RNA extraction. Gene expression levels were normalized to APX3 and presented as values relative to that of the WT kept at 20 °C. Error bars indicate s.d. (n = 3). The P-value for the interaction (genotype x temperature) is shown at the top. The numbers above the bars indicate the ratio of gene expression levels at two different temperatures (28 °C/20 °C). Source data are provided as a Source Data file.

