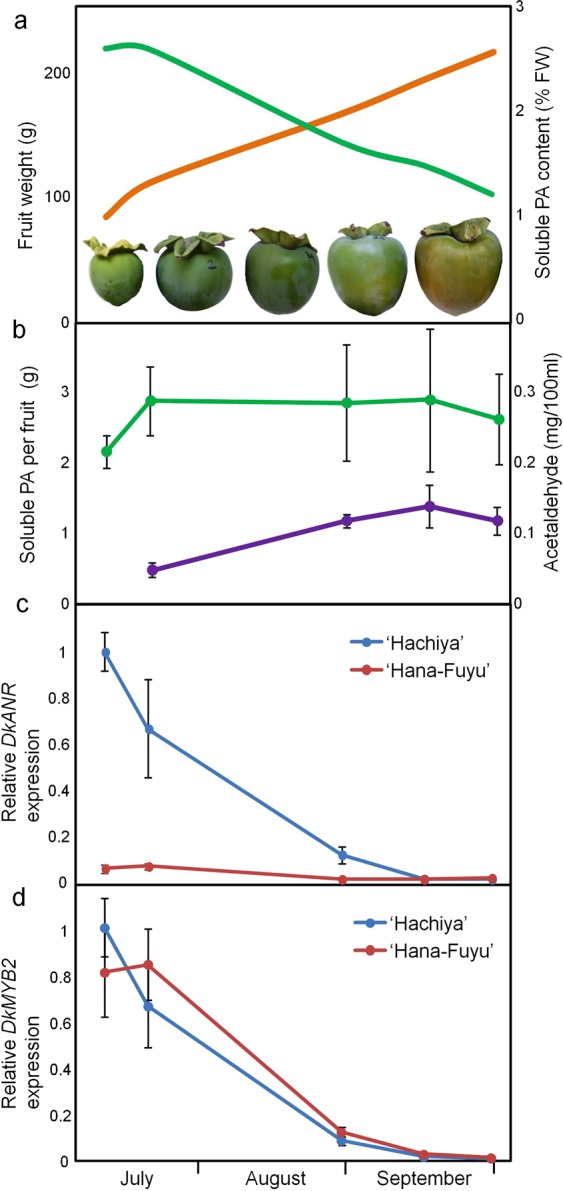
Figure 3.

Proanthocyanidin (PA) content and gene expression during fruit development in persimmon. Fruit weight (orange line) and PA relative content (green line) in ‘Hachiya’ cultivar at different fruit development stages (a). Acetaldehyde accumulation (violet label) and total estimated PA content per fruit unit (green label) in ‘Hachiya’ (b). Relative gene expression of DkANR (c) and DkMYB2 (d) by qRT-PCR in the fruit samples shown in (a,b). The astringent cultivar ‘Hachiya’ (blue label) and the non-astringent cultivar ‘Hana Fuyu’ with the ast mutation (red label) have been analyzed. Data are means from four different fruits for anatomical and chemical analysis, and two biological replicates for gene expression. Error bars represent standard deviations.
