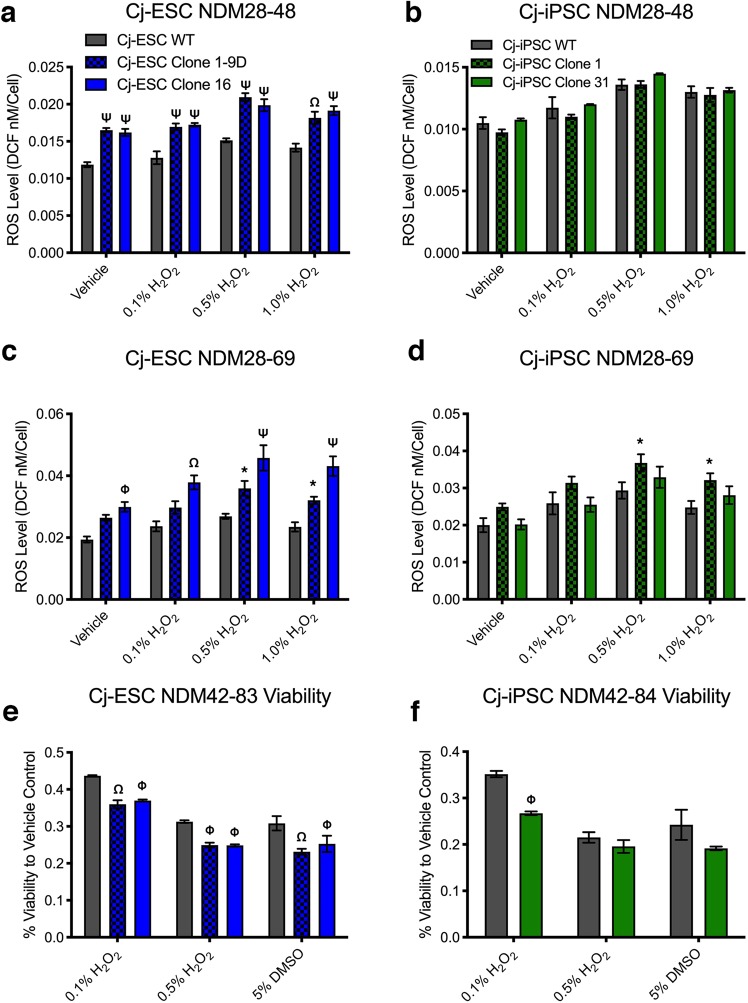
Figure 5.
ROS and viability assays of wild type and LRRK2 G2019S neurons. (a) Cj-ESCs, and (b) Cj-iPSCs assayed for ROS levels after treatment with vehicle, 0.1%, 0.5%, and 1.0% hydrogen peroxide after 20 days of maturation (Graph key represents each column of the figure). (c) Cj-ESCs and (d) Cj-iPSCs assayed for ROS levels after an additional 20 days of culture. All ROS graphs are shown as a concentration of DCF compound per cell as a readout of intracellular ROS abundance. (e) Cj-ESCs and (f) Cj-iPSCs assayed for viability after treatment with 0.1%, 0.5% hydrogen peroxide, or 5% dimethylsulfoxide after 40 days of maturation. Viability was normalized to control wells treated with vehicle; n = 3 separate wells per line and condition. (Two-way ANOVA with Bonferroni correction comparing cell lines to condition with significance presented on the graphs only in comparison to wild type: p < 0.05*, 0.01Φ, 0.001Ω, 0.0001Ψ).

