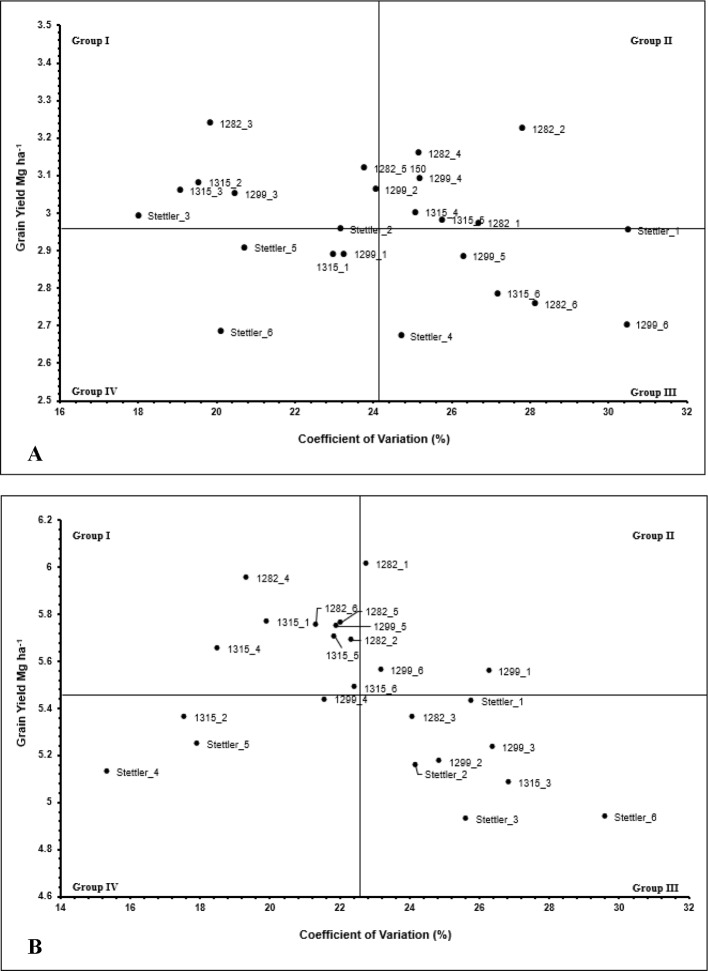
Figure 3.
Biplots summarizing yield means vs. coefficient of variation (CV) for (A): sites south of 51°N latitude, (B) sites north of 51°N latitude. Abbreviations are as follows: I) first number/name represents the wheat line (AC Stettler, LQ1282A, LQ1299A, and LQ1315A). II) Second number represents planting date (1–6). Grouping categories: group I: high mean, low variability; group II: high mean, high variability; group III: low mean, high variability; group IV: low mean, low variability.

