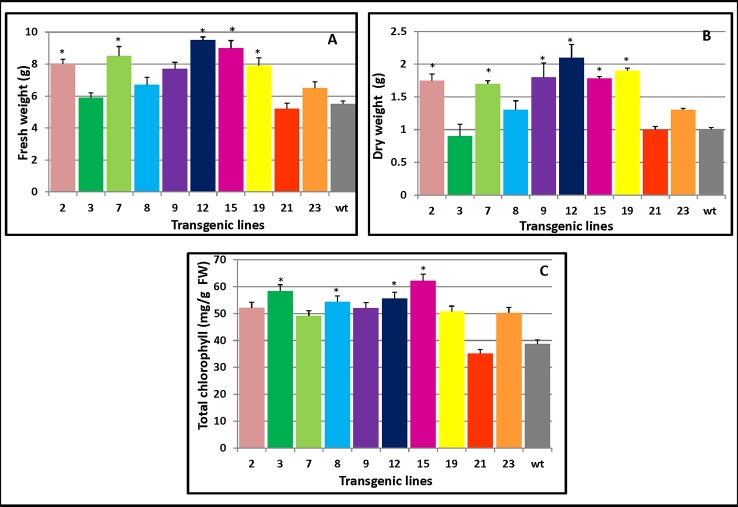
Figure 5.
Changes in the biomass and chlorophyll contents of PmCesA2 poplar transgenic lines. (A) Fresh weights and (B) dry weights of transgenic lines. (C) Chlorophyll contents of the leaves of different PmCesA2 transgenic lines. All values are expressed as means ± SD (n = 3 biological replicates), * denotes significance at p < 0.05.

