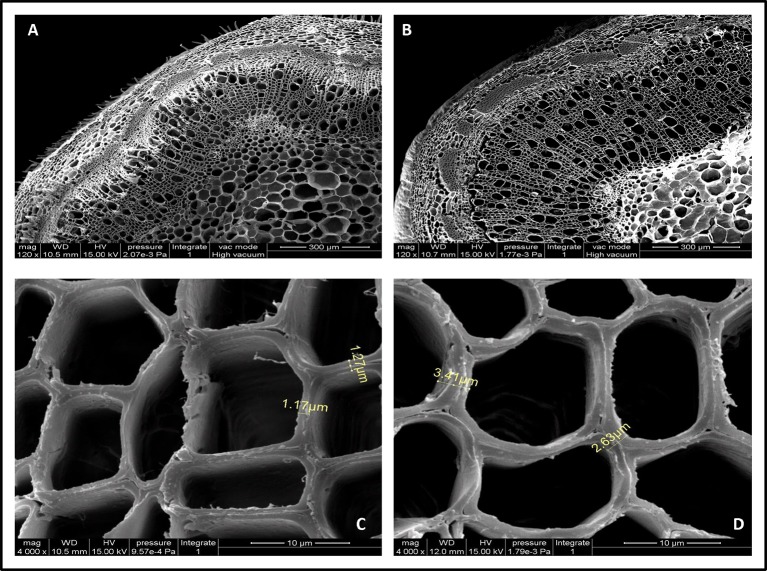
Figure 7.
Scanning electron micrographs of the 10th internode of control and transgenic line plants. (A, C) are from wild-type poplar plants; (B, D) are from the transgenic line. Short yellow lines in (C, D) depict the difference between the cell wall thicknesses in the transgenic line and the wild-type plants. (B) Overexpression of CesA2 displayed increased the number of secondary xylem cells compare with WT (A).

