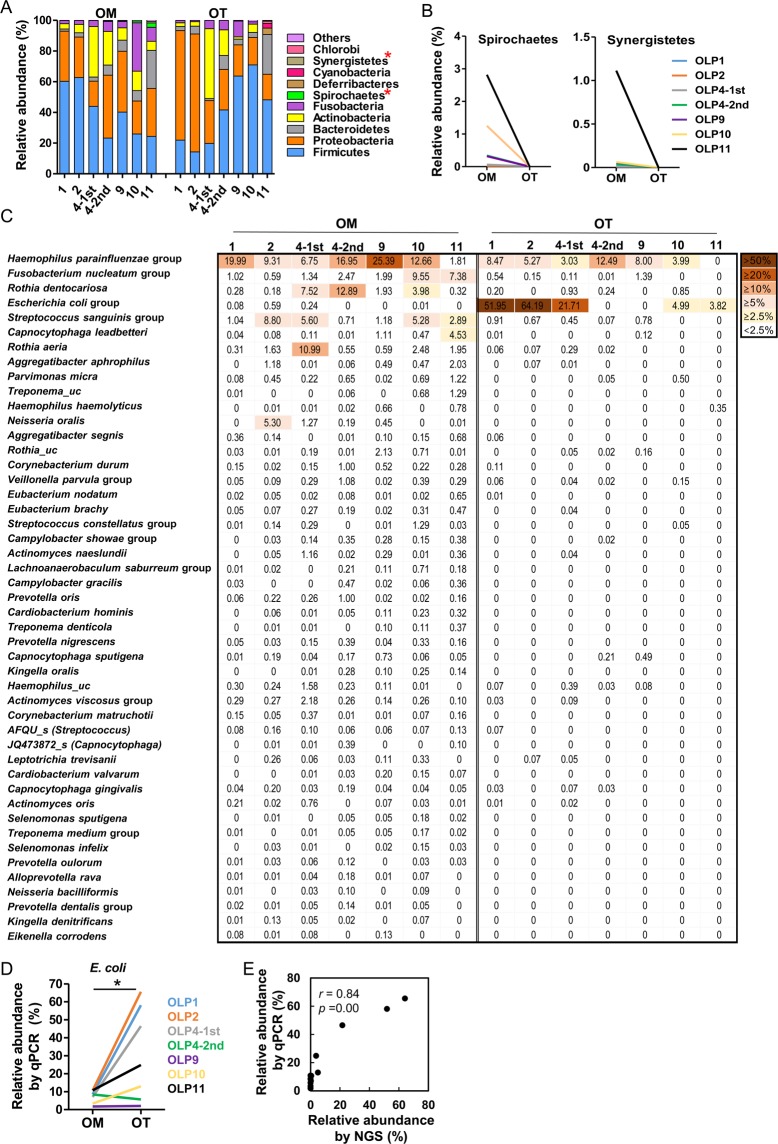
Figure 2.
Differences in relative abundance between the mucosal surface and intratissue communities at the phylum and species levels. (A) The members of the top 10 phyla are shown. (B) Two phyla were differentially distributed between the two communities. (C) The relative abundances of 47 species/phylotypes differently distributed (p < 0.05 by two-tailed Wilcoxon signed-rank test) between two groups are shown as a heat map. (D) The relative abundance of E. coli was estimated by real-time PCR using universal- and E. coli-specific primers. (E) Correlation plot of relative abundances obtained by high-throughput sequencing and qPCR methods. *p < 0.05 by two-tailed Wilcoxon signed-rank test. r and p values by Spearman’s rank correlation test.

