Figure 5.
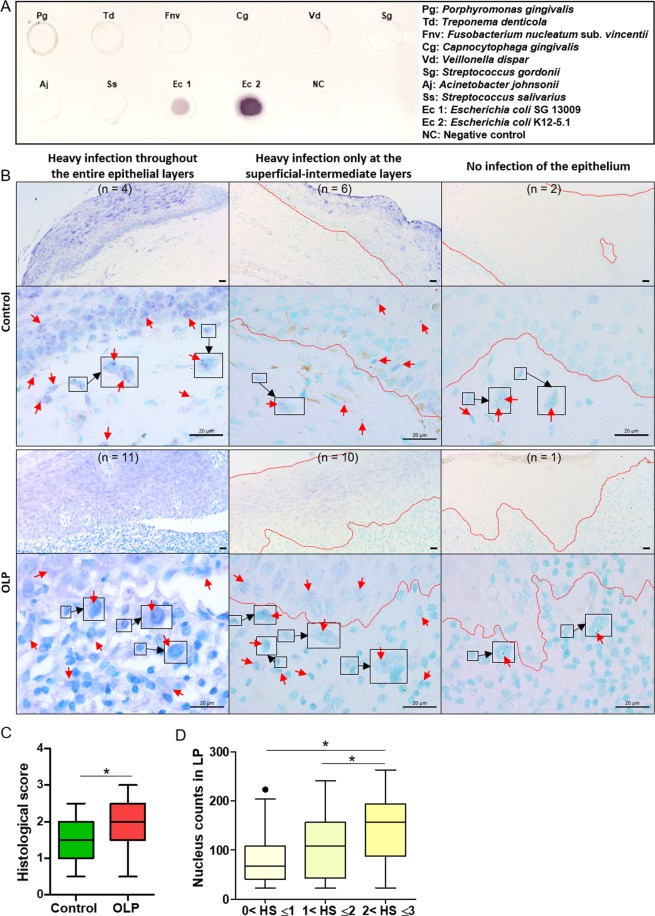
Detection of E. coli in control and OLP tissues by in situ hybridization (A) The specificity of the digoxigenin-labeled probe for E. coli was confirmed by dot blot assay. Bacterial gDNA from nine bacterial species was used for the specificity test. (B) Representative in situ detection patterns of E. coli in control (n = 12) and OLP (n = 22) tissues. The numbers in parentheses indicate the number of samples with a similar pattern in the epithelium. In the OLP tissue presented in the left panel, all lamina propria cells had bacterial signals. Representative E. coli-infected lamina propria cells are enlarged in squares. Scale bars, 20 µm; red arrows, in situ signals for E. coli; dotted red lines, the outline of the epithelium. (C) The frequency of lamina propria cells infected with E. coli was scored (score 0, signal absent; score 1, <30% cells harboring bacterial signal; score 2, 30–60% cells harboring bacterial signal; score 3, >60% cells harboring bacterial signal). *p < 0.05 by Mann-Whitney U test. (D) The number of cells in the lamina propria are plotted with the histological score (HS). *p < 0.05 by Kruskal-Wallis test, followed by Mann-Whitney U test.

