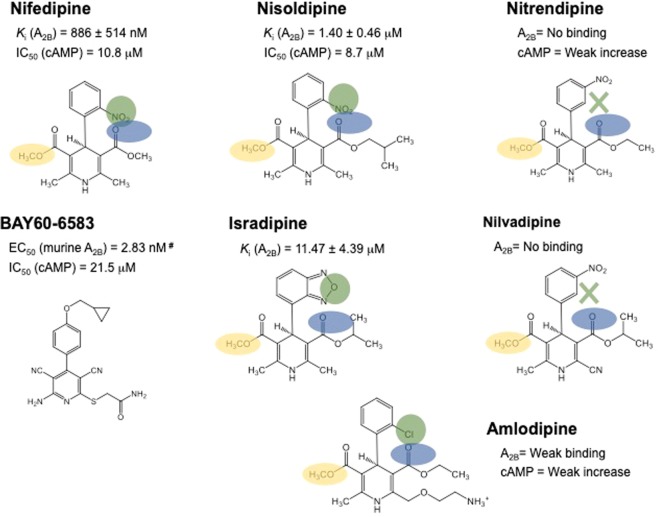
Figure 1.
Summary of the compounds. ‘Ki (A2B)’ values are the [3H]-DPCPX binding assay results and ‘cAMP’ values are the adenosine-induced cAMP assay results. Pharmacophore analysis of the compounds was performed. Green, blue, and orange circles represent the hydrogen donor site binding His2807.43, a hydrogen donor with side-chain binding to Tyr101.35, and the common –OCH3 group close to Ser2797.42, respectively. Green cross ‘X’ represents the mismatch between the ligand NO2 group and the pharmacophore. #, the values of BAY60-6583 were adopted from van der Hoeven et al.44.

