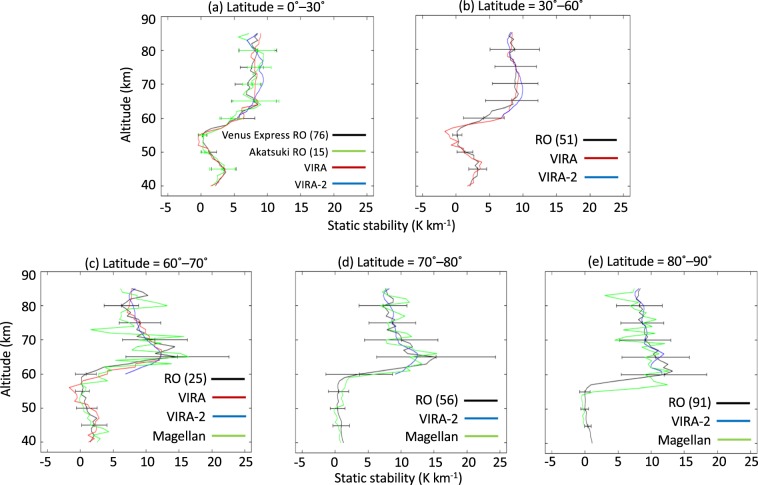
Figure 5.
Comparison of the mean static stability obtained from radio occultation measurements (black) with VIRA (red), VIRA-2 (blue) and Magellan radio occultation measurements (green). In each panel, the number within parentheses is the number of radio occultation measurements made at an altitude of 50 km. Latitudinal ranges are (a) 0°–30°, (b) 30°–60°, (c) 60°–70°, (d) 70°–80° and (e) 80°–90°, and the altitude range is 40–85 km. Only at latitudes of 0°–30°, the radio occultation data are divided into those obtained on Venus Express (black) and Akatsuki (green) missions. Static stability obtained from radio occultation measurements are zonally and temporally averaged. Error bars in each panel represent the standard deviation of the static stability obtained from radio occultation measurements.

