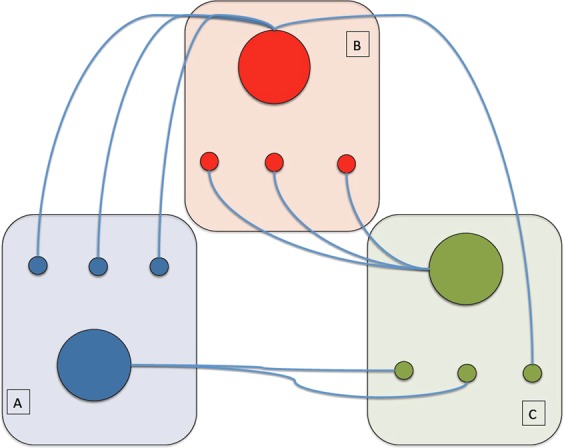
Figure 9.

Schematic of a negative brain functional network. Blue, red and green functional modules (indicated by A, B and C) each include 4 nodes. Within the same module nodes do not interact among each other. The central (bigger) node in each module only interacts with the less connected (smaller) nodes of the other modules. Note that the red central node interacts with two different modules, which means a higher P value compared to the other two central nodes.
