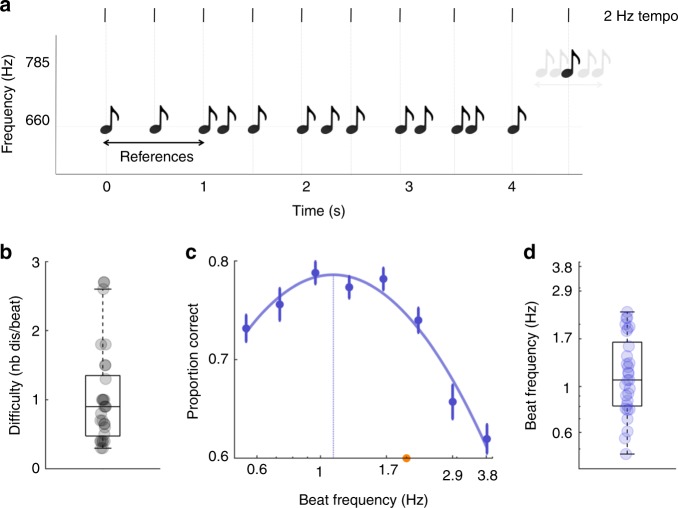
Fig. 1. Passive auditory experiment: experimental design and results.
Experiment 1. a Sequences of pure tones were presented binaurally on each trial. Three reference tones defining the beat frequency (or tempo; vertical lines) of the sequence preceded a mixture of on-beat and off-beat tones. Participants performed a beat discrimination task at the end of each trial, by deciding whether the last tone of the sequence, a spectral deviant (785 Hz vs. 660 Hz), was on or off beat. The beat frequency varied across conditions (from 0.6 Hz to 3.8 Hz). b Individual difficulty level to reach threshold performance for a 2 Hz tempo. Difficulty was modulated by adjusting the density of distractors in the sequence (number of distractors per beat). c Average performance per condition (beat frequency). Data were approximated with a polynomial function (plain line), and an optimal tempo (leading to a maximal performance) could be estimated (vertical line). The orange dot indicates the tempo (2 Hz) that served to estimate the individual difficulty level. d Individual estimates of the optimal tempo. One outlier participant (4.5 Hz) is not visible. Error bars indicate s.e.m. (n = 30). Boxplots represent median and 1.5 times the interquartile range.

