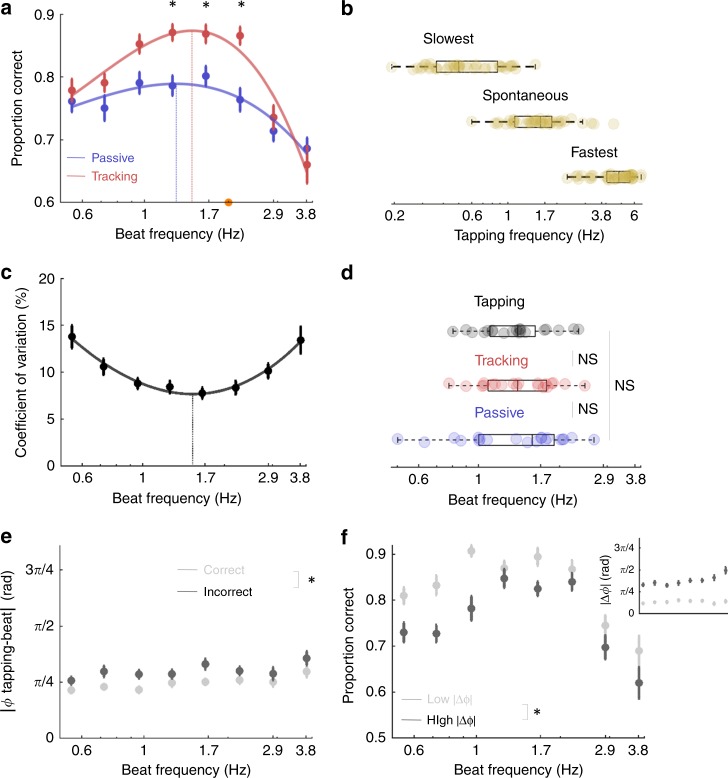
Fig. 2. Motor contribution to auditory temporal attention and free tapping.
a Experiment 2. Average performance per condition (beat frequency) in the passive (blue) and tracking (red) sessions. In the passive session, participants performed the task without moving before the end of the sequence. In the tracking session, participants performed the task while expressing the tempo by moving their index finger. Same conventions as in Fig. 1c. b Free tapping experiment (exp. 3). Individual average frequency of free tapping in three conditions where participants had to rhythmically tap at their slowest, spontaneous and fastest rate. c–f Experiment 2: c Coefficient of variation (CV; i.e., relative standard deviation) of guided tapping across conditions in the tracking session. Same conventions as in Fig. 1c. d Individual estimates of the optimal tempo of auditory temporal attention in the passive (blue) and tracking (red) sessions (from A) and of guided motor tapping in the tracking session (black; from c). e Sensorimotor simultaneity (Φ; in radian), i.e., temporal distance between motor acts and the beat (in absolute value, normalised to the beat period) across conditions in the tracking session, for correct (light grey) and incorrect (dark grey) trials. f Average performance per condition in the tracking session for trials with low (light grey) and high (dark grey) sensorimotor simultaneity indexes. Trials were sorted according to a median-split procedure. The inset plot indicates the associated sensorimotor simultaneity indexes. Error bars indicate s.e.m. (n = 20; (a) paired t-tests, (e–f) repeated-measures ANOVA; *p < 0.05; NS non-significant). Boxplots represent median and 1.5 times the interquartile range.

