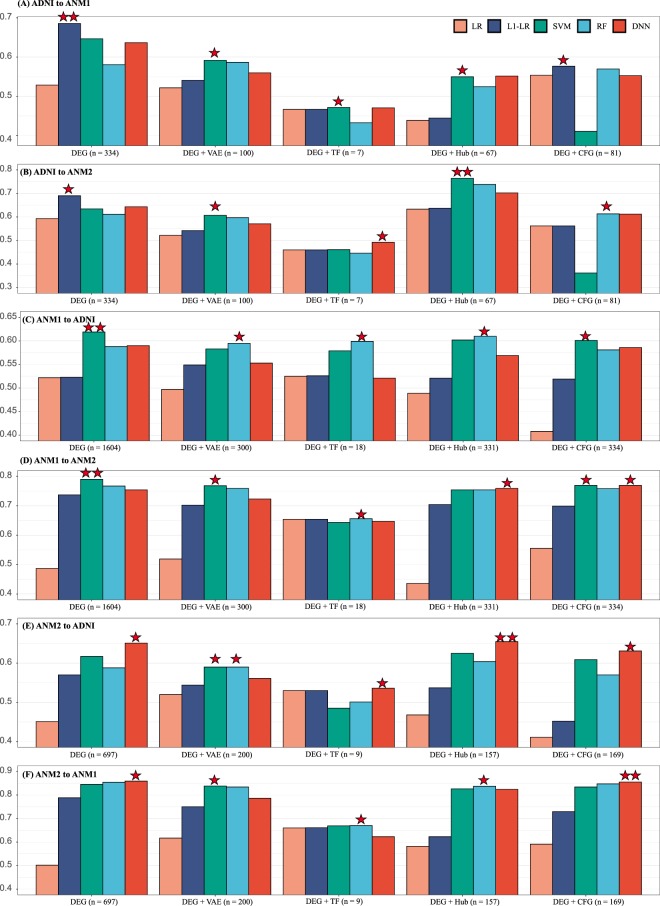
Figure 3.
External validation. (A) ADNI and ANM1 (B) ADNI and ANM2 (C) ANM1 and ADNI (D) ANM1 and ANM2 (E) ANM2 and ADNI (F) ANM2 and ANM1 are arranged as training and testing dataset, respectively. The y-axes in each graph show performance measured by AUC. One star denotes a model with the best performance among five classifiers, and two stars denote the best model among five classifiers and five feature selection methods. The number indicates the number of selected genes in each feature selection method. AUC, area under the curve; AD, Alzheimer’s disease; ADNI, Alzheimer’s Disease Neuroimaging Initiative; ANM, AddNeuroMed.

