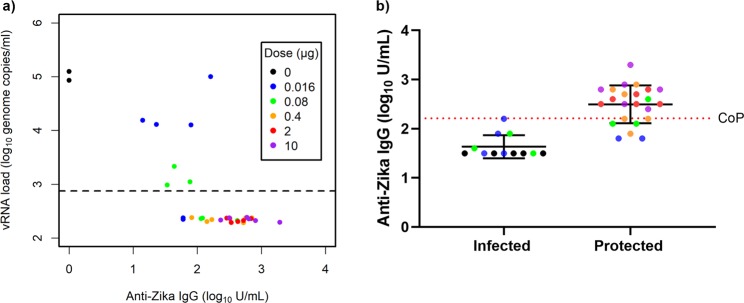
Figure 5.
Anti-Zika IgG antibody titers negatively correlate with Zika vRNA post-challenge. (a) Each point represents an individual macaque. This plot demonstrates the relationship between Day 71 anti-Zika IgG and the peak vRNA concentration following ZIKV challenge. Zika vRNA values below the LLOQ were replaced by half of the LLOQ. The LLOQ is shown as a dashed line. To prevent overlaps in the plot, these data points have been jittered in the vertical direction. (b) To determine the correlate of protection for anti-Zika IgG, the IgG antibody titers (log10 U/mL) of infected (positive for vRNA at any given timepoint) and protected (negative for vRNA) macaques were plotted. Mean and standard deviation are shown for all groups and time points. The correlate of protection for anti-Zika IgG is 2.21 log10 U/mL and was defined as the maximum anti-Zika IgG across all unprotected macaques in this study. CoP = Correlate of protection.

