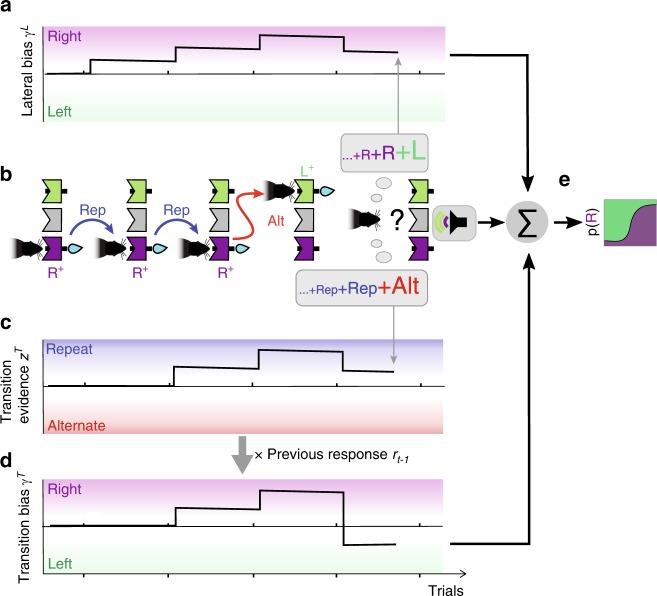
Fig. 3. Dissecting two different history choice biases.
Cartoon of an example series of four choices, R+R+R+L+, illustrating the buildup of the lateral and transition biases. a The lateral bias, capturing the tendency to make rightward or leftward responses, increases toward the right in the first three R+ trials, and compensates this buildup with the last L+ response. Its net impact on the final trial is a rightward bias. b Schematic of the sequence of rewarded responses showing the transitions, defined as the relation between two consecutive responses, being repetitions (Rep, blue arrows) or alternations (Alt, red arrow). The animal computes each choice from combining its expectation based on a weighted sum of previous alternations (bottom gray balloon) and previous responses (upper gray balloon) with the current stimulus sensory information (see last trial). c Transition evidence zT captures the tendency to repeat or alternate the previous response based on the series of previous transitions Rep++Rep++Alt++ predicting a repetition in the final trial. d The transition bias γT is obtained by projecting the transition evidence zT (c) onto the right–left choice space via a multiplication with the previous response rt−1 (see gray arrow). e The evidence provided by the current stimulus is summed to the addition of the biases γLt + γTt and passed through a sigmoid function, yielding the probability of selecting a rightward response (Supplementary Fig. 5).

