
Figure 2.
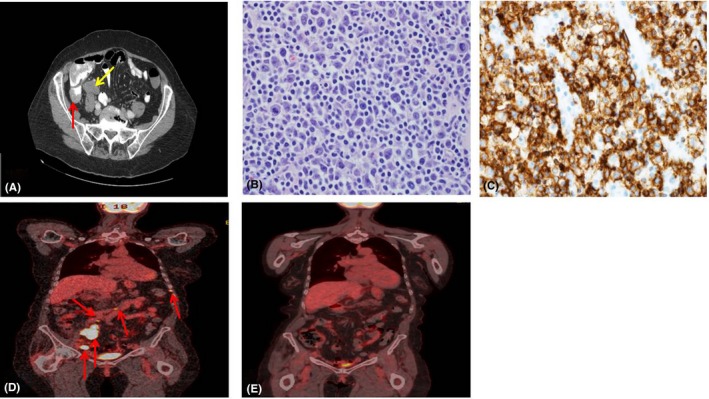
A, CT scan showing a dilated appendix with periappendiceal stranding (red arrow). In addition, there was a 3.8 × 2.1 cm mass in close vicinity (yellow arrow). B, 400× H&E stain of appendix tissue revealing large atypical mononucleated cells. C, 400× CD20 stain of appendix tissue. D, PET‐CT at diagnosis revealing a hypermetabolic intercostal focus between the left seventh and eight ribs, hypermetabolic aortocaval lymph nodes, and hypermetabolic right iliac lymph nodes (red arrows). E, PET‐CT following six cycles of R‐CHOP showing resolution of hypermetabolic areas