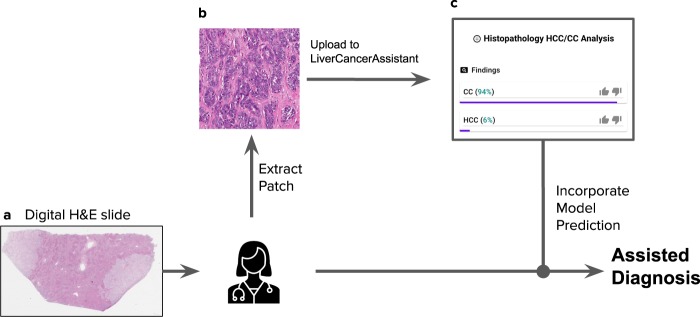
Fig. 3. Pathologist diagnostic workflow with assistance.
After reviewing the H&E whole-slide image (a), the pathologist extracts a tumor patch at ×10 objective magnification (b) and uploads it to the cloud-based model, which outputs predicted probabilities for cholangiocarcinoma (CC) and hepatocellular carcinoma (HCC) into the user interface (c), as well as corresponding class activation maps (not shown). These outputs are integrated with the pathologist’s diagnostic impression, to result in a final assisted diagnosis.

