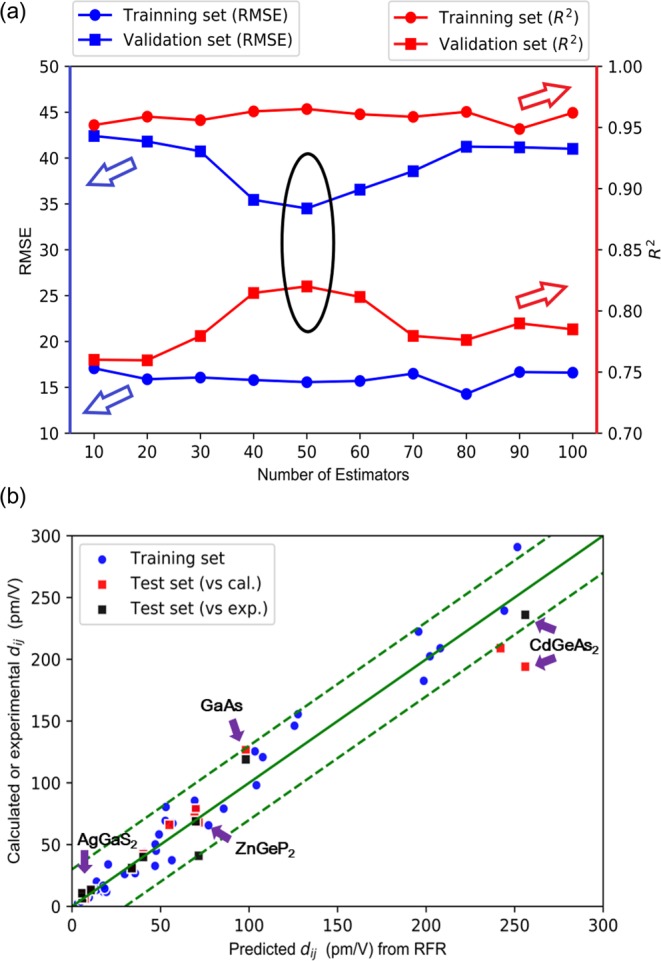
Figure 3.

Performance evaluation and model prediction. (a) The RMSE and R2 of training and validation set with the change of number of estimators. (b) Comparison of DFT training data or experimental data with RFR model predictions for dij. Blue circles represent the training and validation data; red squares represent the test data and the y axis is the calculated value; black squares represent the test data and the y axis is the experimental value. The error is less as the point approaching the green line (y = x).
