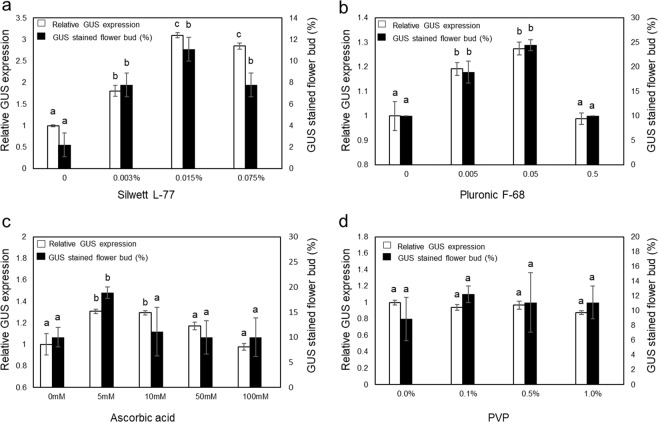
Figure 2.
Effect of chemical additives on transient GUS expression. Agrobacterium GV3101 harboring pEarleyGate 101-uidA was infiltrated with different chemical additives; (a) Silwett L-77, (b) Pluronic F-68, (c) ascorbic acid and d) PVP as measured by image analysis of the GUS-stained female flowers collected 45 days after germination. The total GUS expression value without additives in each figure was used to normalize the relative expression level. Bars indicate ± standard error of the mean. Means followed by the same letter indicate no significant difference (P < 0.05). Statistical analysis was completed using a 1-way ANOVA with Tukey’s multiple comparison test.

