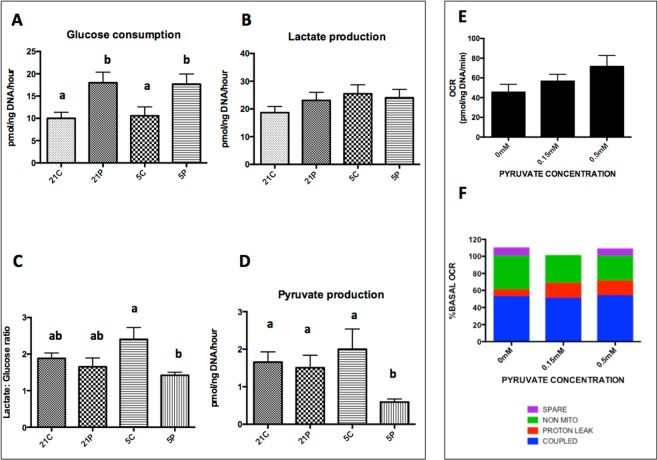
Figure 4.
The effect of 0.15 mM pyruvate and O2 concentration on carbohydrate and oxidative metabolism of COCs during IVM. The effect of 0.15 mM pyruvate and O2 concentration (5% vs. 21%) on glucose consumption (A), lactate production (B), lactate:glucose ratio (C) and pyruvate production (D) during IVM. Condition abbreviations on X axes are as follows; 21C = Control maturation medium and maturation at 5% CO2 in air (21% O2); 21 P = Pyruvate containing Maturation Medium (control medium as above with the addition of 0.15 mM Pyruvate) and incubation at 5% Co2 in air (21% O2); 5C = Control maturation medium and maturation at 5% CO2, 5% O2 and 90% N2; 5 P = Pyruvate containing maturation medium and incubation at 5% CO2, 5% O2 and 90% N2. Bars represent mean ± SEM and different superscripts denote significance differences between groups (P < 0.05). Effect of medium pyruvate concentration (0, 0.15, 0.5 mM) during IVM on basal OCR (E; n = 45). Mean ±SEM are presented. Effect of pyruvate concentration during IVM on mitochondrial function as determined following the sequential addition of respiratory inhibitors (F; n = 45). O2 consumption rate (OCR) coupled to ATP production (BLUE), OCR associated with proton leak (RED), non-mitochondrial OCR (GREEN) and spare respiratory capacity (PURPLE) are expressed as % basal OCR. Mean values are stacked and there were no significant differences between groups.

