Fig. 6.
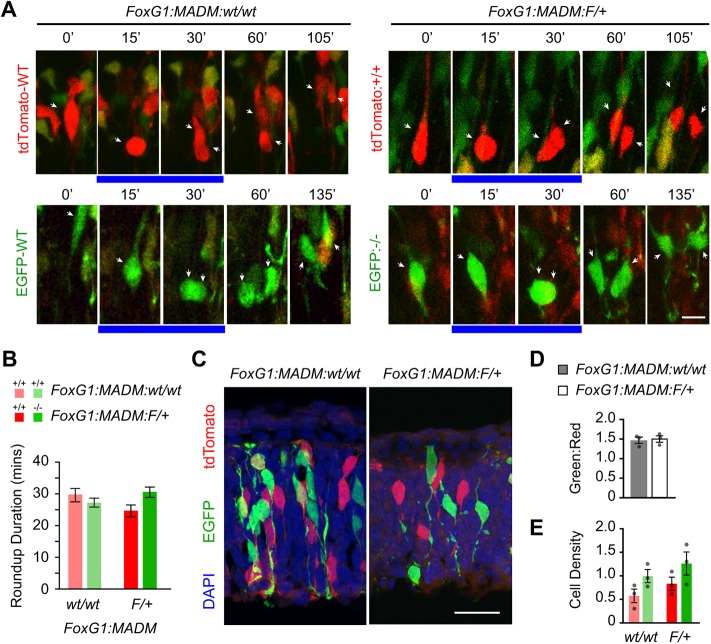
Sp2 is dispensable for proliferation and expansion of NSCs. (A) Representative time-lapse en face images of FoxG1:MADM:wt/wt and FoxG1:MADM:F/+ cortical wholemounts (time indicated in minutes above each panel). Arrows indicate cells tracked for each genotype and blue bars indicate frames in roundup. Scale bar: 10 µm. (B) Quantification of the time spent in roundup. FoxG1:MADM:wt/wt: red, n=30 cells; green, n=30 cells. FoxG1:MADM:F/+: red, n=34 cells; green, n=37 cells. One-way ANOVA, F=1.828, P=0.15. (C) Representative images of E10.5 FoxG1:MADM:wt/wt and FoxG1:MADM:F/+ cortices immunoenhanced for EGFP (green) and tdTomato (red). Nuclei are counterstained with DAPI (blue). Scale bar: 25 µm. (D) G:R for cells in E10.5 cortices, t=1.113, P=0.33, n=3 embryos per genotype. (E) Red and green cell density; density values are ×104/mm3. FoxG1:MADM:wt/wt, t=2.082, P=0.11; FoxG1:MADM:F/+, t=1.519, P=0.20. n=3 animals per genotype from three independent litters. Dots represent values from individual embryos. Data are mean±s.e.m.

