Fig. 5.
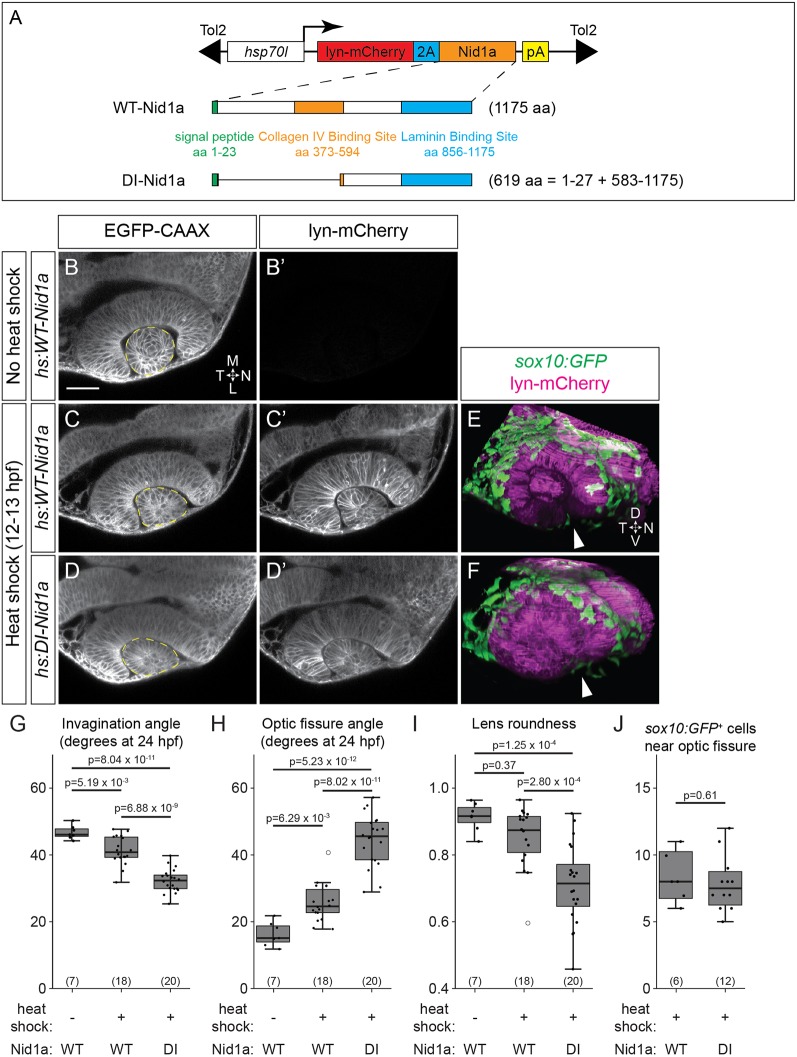
Dominant-interfering nidogen disrupts optic cup morphogenesis. (A) Schematics of full length (WT) and dominant-interfering (DI) zebrafish nidogen 1a and transgene constructs. (B-D′) Tg(bactin2:EGFP-CAAX) transgenics also carrying either hs:WT-Nid1a (B-C′) or hs:DI-Nid1a (D,D′) transgenes. Control embryos (B), not heat shocked, are lyn-mCherry− (B′); experimental embryos were heat shocked at 12-13 hpf (C-D′). Dorsal view, single confocal sections. (E,F) Tg(sox10:GFP)+;hs:WT-Nid1a (E) or hs:DI-Nid1a (F) transgenics heat shocked at 12-13 hpf. GFP+ neural crest cells migrate around the optic cup and into the optic fissure (arrowheads) in both conditions. Lateral view, 3D renderings, 24 hpf. (G-J) Quantification of invagination angle (G), optic fissure angle (H), lens roundness (I) and sox10:GFP+ cell number at the optic fissure (J). Dashed lines in B-D mark lens outlines used for roundness measurements. sox10:GFP+ cells were counted as near the optic fissure if they were located in the optic fissure or were in contact with a margin of the optic fissure. n (embryos) shown at base of graphs, from one to three experiments. P-values were calculated using one-way ANOVA with Tukey HSD post-hoc test (G-I) or Welch's t-test (J). Scale bar: 50 μm. D, dorsal; L, lateral; M, medial; N, nasal; T, temporal; V, ventral.

