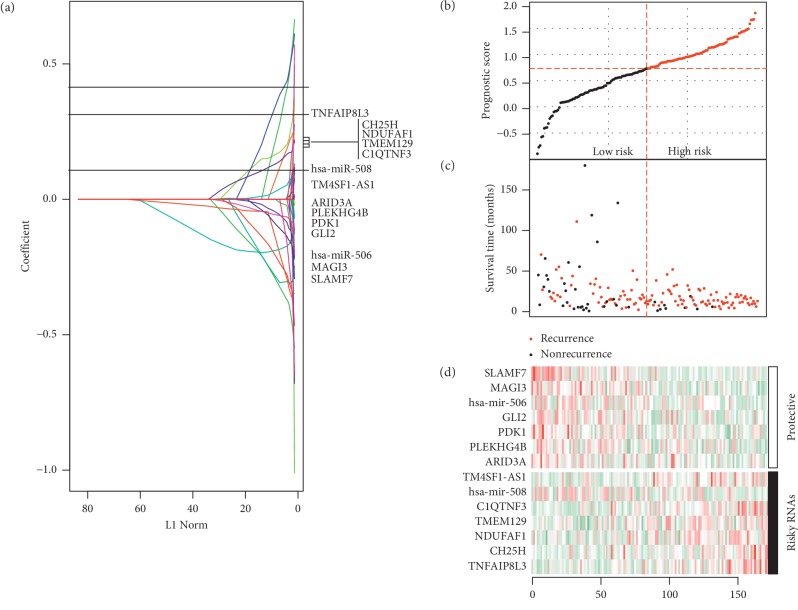
Figure 2.
Construction of multi-RNA-based risk score model. (a) LASSO coefficient profiles of 14 survival-related RNAs; (b) the distribution of risk score in each patient in the training dataset; (c) the outcome of recurrence status and survival time. The red dotted line represents the optimum cutoff dividing patients into low-risk and high-risk groups; (d) heat map of the RNAs in the prognostic model.

