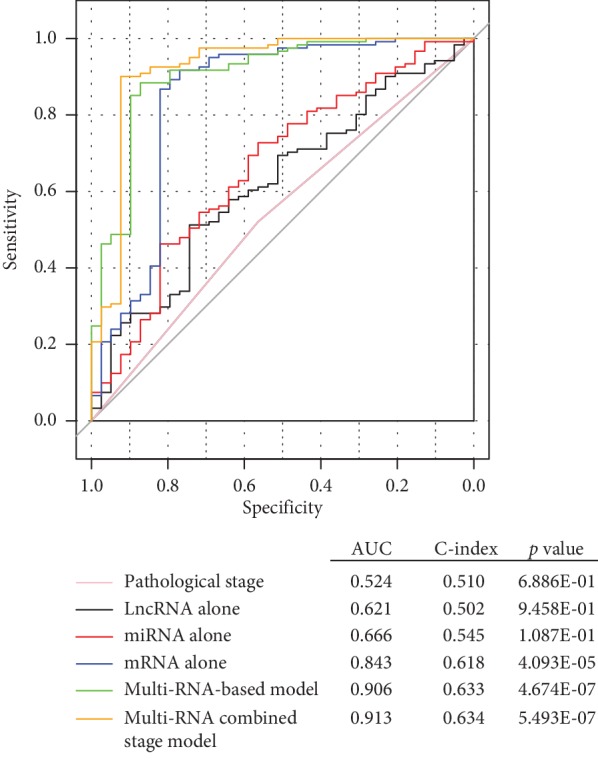
Figure 5.

Comparison of the prognostic accuracy among the risk score model, pathologic staging, and mRNA, miRNA, and lncRNA alone. This analysis was performed using the training dataset. mRNA, messenger RNA; lncRNA, long noncoding RNA; miRNA, microRNA; ROC, receiver operator characteristic; AUC, area under curve; C-index, Harrell's concordance index. p value indicates the association between predicted survival and actually observed survival.
