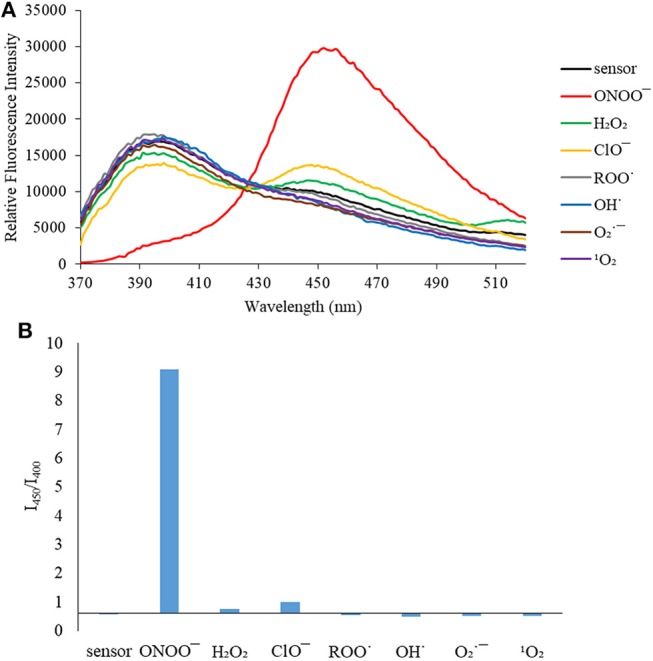
Figure 3.

(A) Selectivity data for CL (5 μM): emission spectrum in the presence of ONOO− (50 μM), OH· (500 μM), (500 μM), 1O2 (500 μM) after 5 min. H2O2 (1 mM), ROO· (500 μM) and ClO− (500 μM) were measured after 30 min. The data was obtained in PBS buffer, pH = 7.4 at 25°C at λex = 340 (bandwith: 20) nm on a BMG Labtech CLARIOstar® plate reader. (B) Selectivity data for CL (5 μM): relative intensity ratio in the presence of ONOO− (50 μM), OH· (500 μM), (500 μM), 1O2 (500 μM) after 5 min. H2O2 (1 mM), ROO· (500 μM) and ClO− (500 μM) were measured after 30 min. The data was obtained in PBS buffer, pH = 7.4 at 25°C at λex = 340 (bandwith: 20) nm on a BMG Labtech CLARIOstar® plate reader.
