Figure 3.

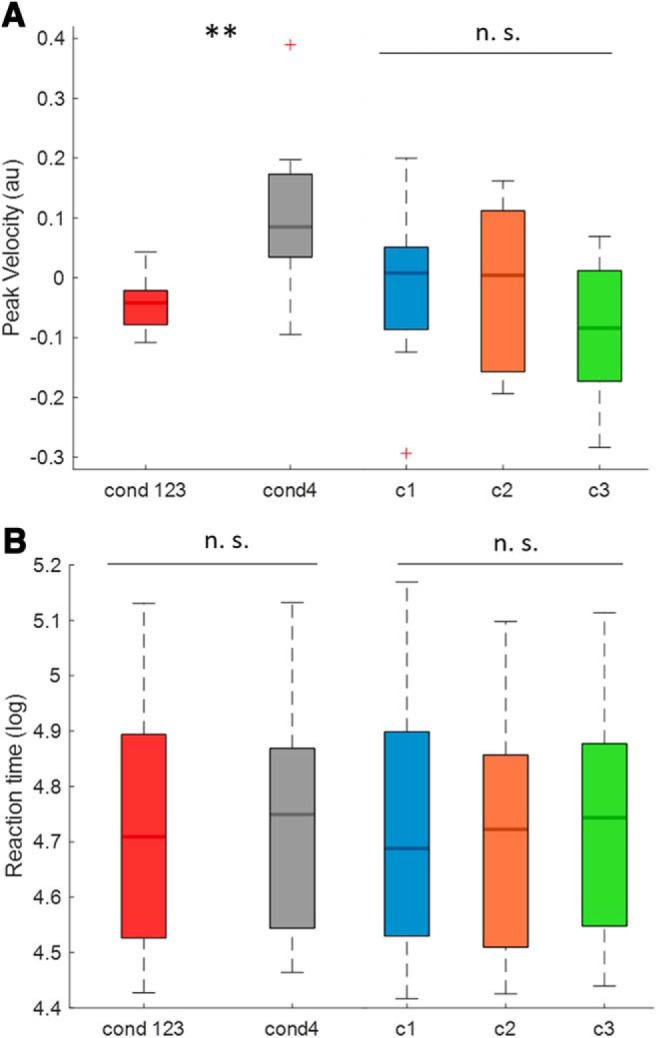
Effect of burst conditions on peak velocity (PV) and reaction time (RT). A, The mean z-scored PV of the joint Conditions 1–3 (go-cues time-locked to bursts) and the mean PV of Condition 4 (go-cues not time-locked to bursts). The PV during the burst conditions is significantly slower than in Condition 4 (n = 15, z = 12, p = 0.0043); it also illustrates the PV of Conditions 1–3 individually (burst conditions) across subjects. No significant difference was found between the three burst conditions (RM-ANOVA, no significant main effect, F(2,28) = 1.4663, p = 0.25). B, The mean log-transformed RT of the joint Conditions 1–3 (burst conditions) and the mean RT of Condition 4 (go-cues not time-locked to bursts). This comparison did not reveal a statistical difference (n = 15, z = 39, p = 0.25); it also illustrates the RT of Conditions 1–3 individually (burst conditions) across subjects. No significant difference was found between the three burst conditions (RM-ANOVA, no significant main effect, F(2,28) = 1.693, p = 0.20). Red crosses correspond to value above the 75th or below the 25th percentile. **p < 0.01. n.s. = not significant.
