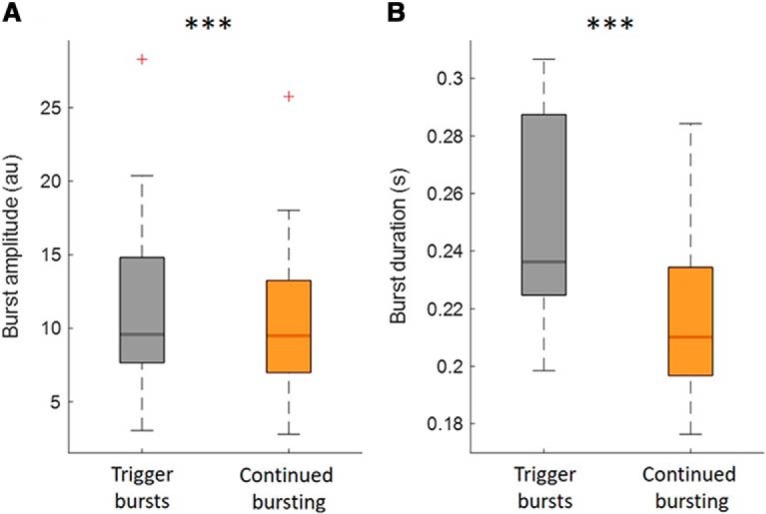
Figure 5.

Amplitude and duration of trigger-bursts and of continued bursting. This illustrates that both burst amplitude (A) and burst duration (B) of trigger-bursts were higher compared with any bursts that followed before movement onset (n = 15, z = 117, p < 0.001; n = 15, z = 120, p < 0.001). Data are averaged across subjects. Red crosses correspond to value above the 75th percentile. ***p < 0.001.
