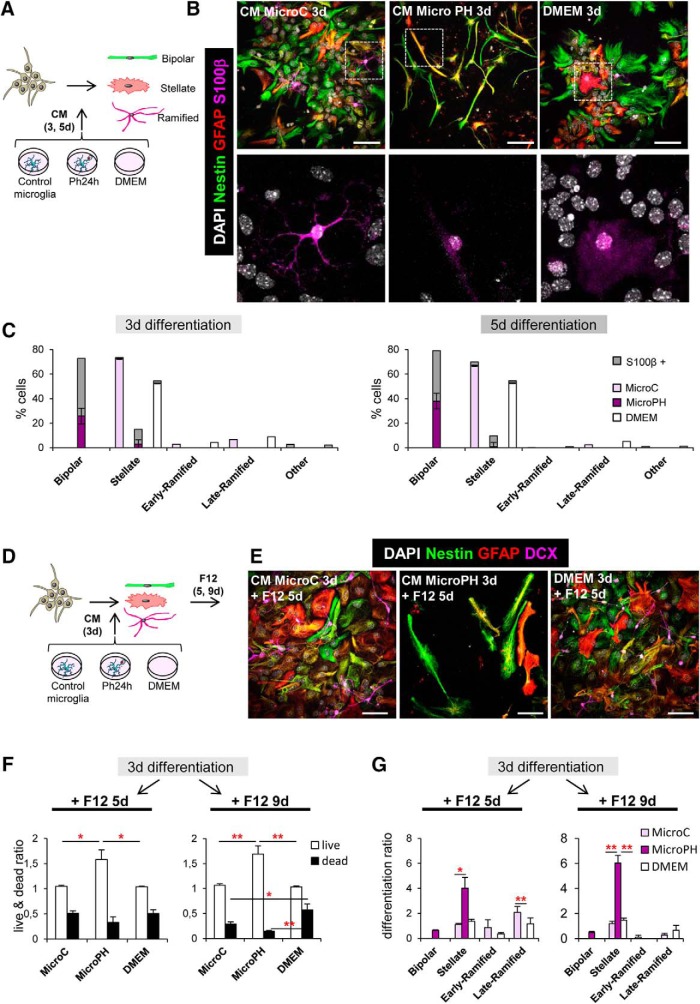
Figure 10.
Characterization of CM cell types by S100β and multipotency assays. A, Experimental design of the in vitro neurogenesis assay for S100β staining. B, Representative confocal microscopy images of NPCs treated with CM microC or microPH. DMEM was used as control. C, Percentage of expression of S100β in the different cell types found after 3 and 5 d treatment with CM microC or microPH. The category “Other” refers to cells with strong S100β expression, no GFAP and a ramified morphology suggest that they may be oligodendrocytes (Hachem et al., 2005). D, Experimental design of the in vitro multipotency assay. E, Representative confocal microscopy images of NPCs treated with CM microC, microPH or DMEM followed by 5 d of DMEM/F12. F, Ratio of live/dead cell density over the cells at 3 d after each treatment. G, Differentiation ratio of each phenotype after 3 d treatment with CM microC or microPH followed by 5 or 9 d DMEM/F12. Scale bars: B, E, 20 μm (inserts in B, 10 μm); B, F, z = 9 μm. N = 3 independent experiments (C, F, G). Error bars represent mean ± SEM. *p < 0.05, **p < 0.01. Values of statistics used are shown in Table 7.

