Figure 11.
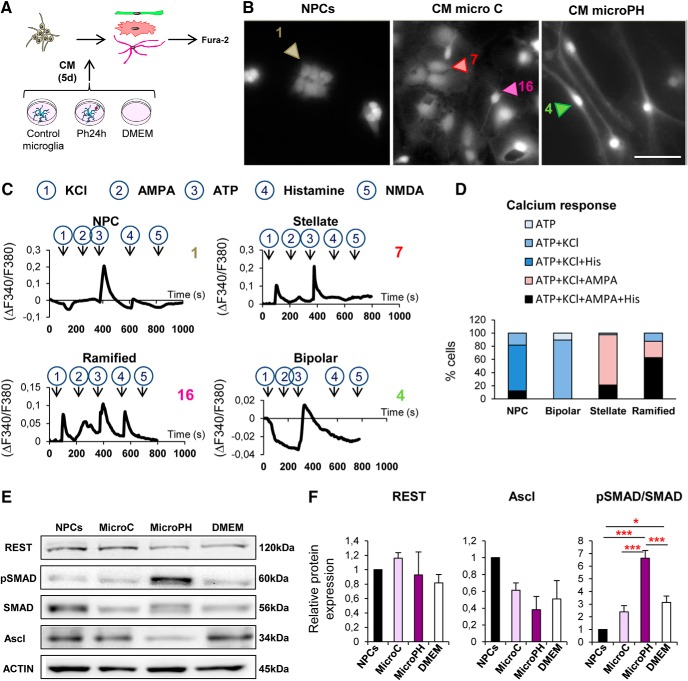
Characterization of CM cell types by calcium imaging and late survival/differentiation assays. A, Experimental design of the in vitro calcium imaging assay. NPCs were treated with CM microC or microPH for 5 d and the resulting stellate, ramified and bipolar cells were incubated and loaded with Fura-2 AM and afterward, cells were challenged with KCl, AMPA, ATP, histamine, and NMDA to measure their Ca+2 response. B, Representative epifluorescence microscopy images of neuroprogenitors treated with CM microC or microPH for 5 d. Freshly dissociated NPCs were used as control. C, Calcium responses to consecutive stimuli (KCl, AMPA, ATP, histamine, NMDA) determined as a ratio of Fura2 fluorescence of cells shown in B. D, Percentage of cell phenotypes responding to each stimulus (38 stellate cells, 8 ramified cells, 19 bipolar cells, and 33 NPCs; pooled from N = 2 independent experiments). The baseline was calculated as the mean of the first 60 s of recording for each cell. Only peaks that increase or decrease three times the SEM of the baseline were considered as a positive response. E, Representative blots showing relative levels of REST, Ascl, phospho-SMAD1/5/9, and SMAD1 in NPCs treated with CM microC or microPH for 3 d. F, Quantification of the relative expression of REST, Ascl and the ratio phospho-SMAD/total-SMAD in NPCs treated with CM microC or microPH for 3 d. β-actin was used as a loading control. Scale bar, 20 μm. N = 2 independent experiments (D, pooled cells), N = 3 independent experiments (F). Error bars represent mean ± SEM. *p < 0.05, ***p < 0.001 by Holm–Sidak post hoc test (after one-way ANOVA was significant at p < 0.05). Values of statistics used are shown in Table 8.

