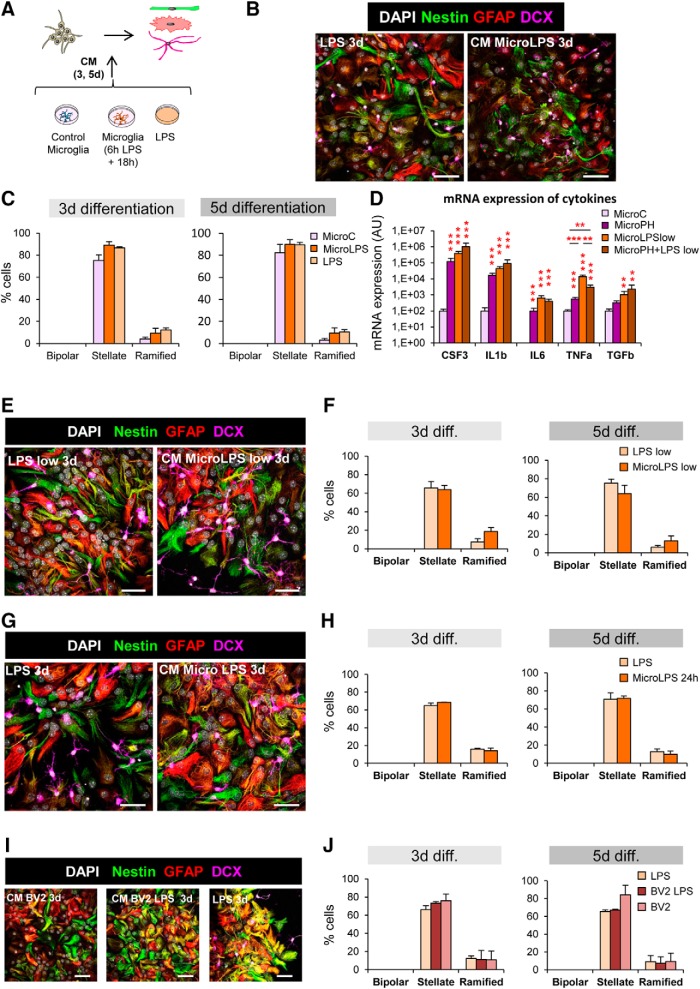
Figure 12.
Effect of CM microLPS on neurogenesis in vitro. A, Experimental design of the in vitro neurogenesis assay. B, Representative confocal microscopy images of neuroprogenitors treated with CM MicroC, CM MicroLPS 6 h + 18 h (1 μg/ml) or LPS alone (1 μg/ml; 24 h). C, Percentage of cell types found after 3 or 5 d treatment with CM MicroC, CM MicroLPS (6 h + 18 h), LPS. The group “bipolar cells” is included for visualization purposes, but as this cell type was not found with any of the treatments, it was not included in the statistical analysis. Three-way ANOVA (treatment × life × time) showed interactions between the different factors and thus the data were split into several one-way ANOVAs, which showed no significant effect of the treatment. D, mRNA expression levels of selected cytokines by real-time qPCR in control microglia (microC), 24 h phagocytic microglia (microPH), as well as control and phagocytic microglia treated with LPS (150 ng/ml, 18 h). HPRT was selected as a reference gene. E, Representative confocal microscopy images of NPCs treated with CM from LPS treated microglia or LPS alone (low concentration: 150 ng/ml; 18 h). F, Quantification of the different cell types found after 3 or 5 d treatment with CM from LPS treated microglia or LPS. G, Representative confocal microscopy images of NPCs treated with CM MicroLPS or LPS (1 μg/ml; 24 h). H, Quantification of the different cell types found after 3 or 5 d treatment with CM MicroLPS or LPS (high concentration: 1 μg/ml; 24 h). I, Representative confocal microscopy images of neuroprogenitors treated with CM BV2, CM BV2 LPS high or LPS high (1 μg/ml; 24 h). J, Quantification of the different cell types found after 3 or 5 d treatment with CM BV2, CM BV2 LPS, or LPS. Scale bars: B, E, G, I, 20 μm, z = 6.3 μm. N = 3 independent experiments (C), N = 4 independent experiments (D), N = 2 independent experiments (F, H, J). Error bars represent mean ± SEM. **p < 0.01, ***p < 0.001 by Holm–Sidak post hoc test (after one-way ANOVA was significant at p < 0.05). Only significant effects are shown. Values of statistics used are shown in Table 8.

