Figure 2.
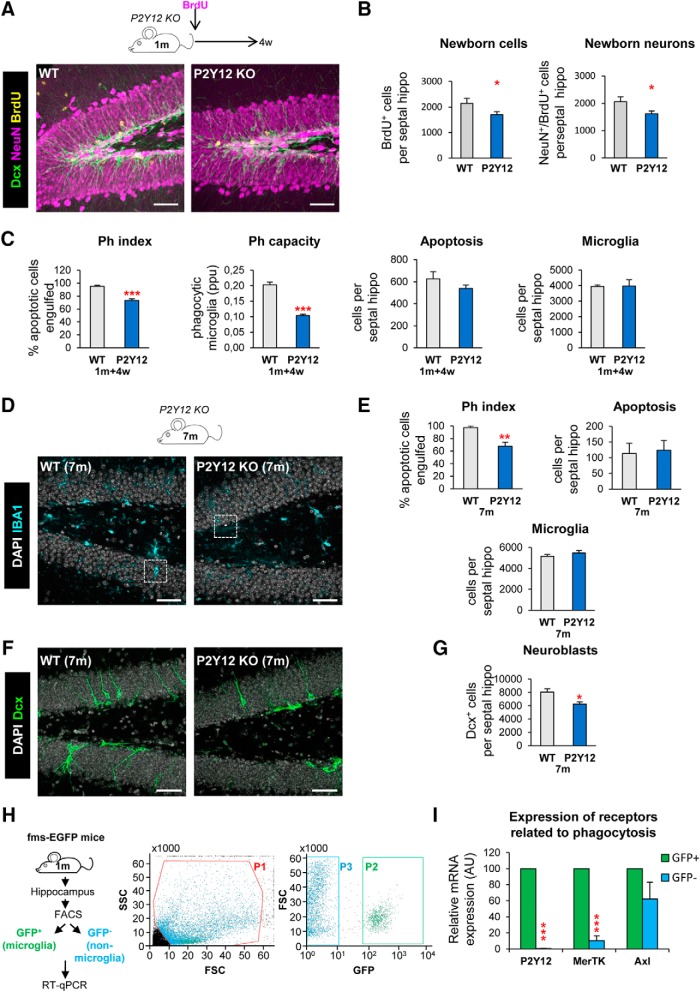
Chronic microglial phagocytosis impairment reduces adult hippocampal neurogenesis in the long term. A, Representative confocal z-stack of P2Y12 KO mice immunofluorescence in the mouse hippocampal DG at 2 months. Neuroblasts were labeled with DCX (green), neurons were labeled with NeuN (magenta) and proliferation was labeled with BrdU (yellow; 4 weeks after BrdU injection). B, New cells and new neurons (NeuN+, BrdU+) in 2-month-old P2Y12 KO mice, 4 weeks after the BrdU injection. C, Percentage of apoptotic cells engulfed (Ph index), weighted average of the percentage of microglia with phagocytic pouches (Ph capacity), apoptotic cells and microglia per septal hippocampus in P2Y12 KO mice 4 weeks after BrdU injection (2m). D, Representative maximum projection of confocal z-stack of P2Y12 KO mice immunofluorescence in the mouse hippocampal DG at 7 months (7 m). Microglia were labeled with Iba1 (cyan) and apoptotic nuclei were detected by pyknosis/karyorrhexis (white, DAPI). E, Percentage of apoptotic cells engulfed (Ph index), number of apoptotic cells and microglia per septal hippocampus in 7-month-old P2Y12 KO mice. F, Representative confocal z-stack of P2Y12 KO mice immunofluorescence in the mouse hippocampal DG at 7 months. Neuroblasts were labeled with DCX (green). G, Number of neuroblasts per septal hippocampus in 7-month-old P2Y12 KO mice. H, Experimental design used to isolate microglia (GFP+) versus non-microglial cells (GFP−) from 1-month-old fms-EGFP mice using flow cytometry. First, debris was excluded using the P1 gate in FSC versus SSC (left). Next, gates for GFP+ microglia cells (P2) and GFP− non-microglial cells (P3) were defined based on the distribution of the fms-EGFP+ cells in EGFP versus FSC (right). I, Expression of P2Y12, MerTK, and Axl in microglia (GFP+) versus non-microglial cells (GFP−) by real-time qPCR in FACS-sorted cells from fms-EGFP mice hippocampi. OAZ1 (ornithine decarboxylase antizyme 1) was selected as a reference gene. Scale bars: A, D, F, 50 μm; A, z = 20 μm; D, F, z = 17.5 μm. N = 5 mice (A). N = 4–6 mice (E, G), N = 3 independent experiments (H; each from 8 pooled hippocampi), *p < 0.05, **p < 0.01, ***p < 0.001 by Student's t test. Values of statistics used are shown in Table 2.

