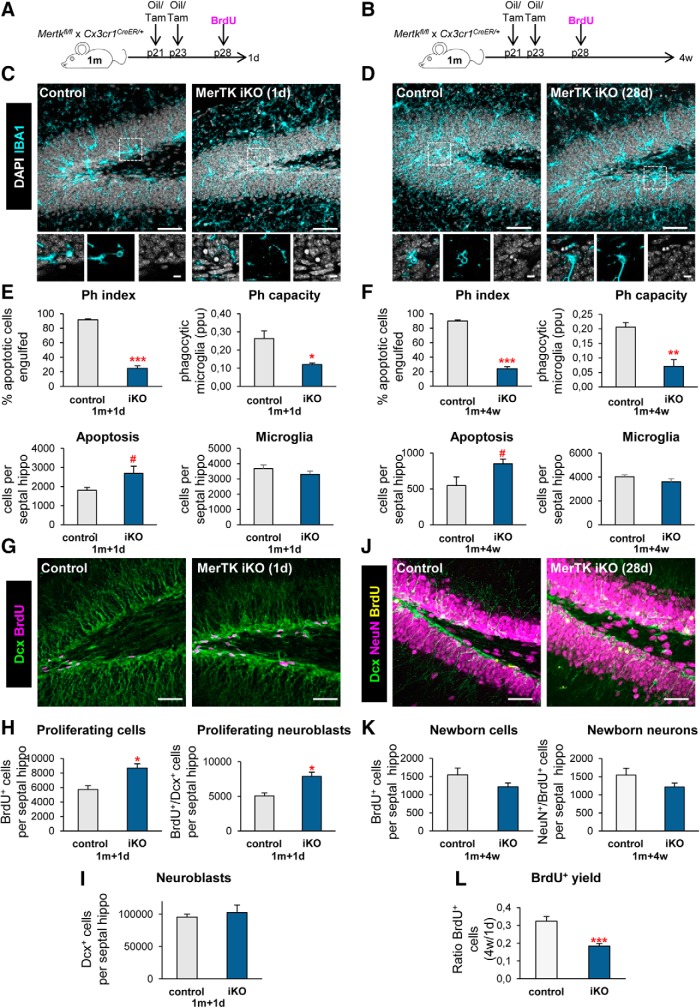
Figure 3.
Acute microglial phagocytosis impairment transiently increases adult hippocampal neurogenesis. A, B, Experimental design in microglial-specific MerTK inducible KO mice, generated by crossing Mertkfl/fl and Cx3cr1CreER mice treated with tamoxifen (iKO) or corn oil (control) at P21 and P23 and injected with BrdU at p28 (100 mg/kg). Mice were killed at 1 d (A) or 4 weeks (B) after the BrdU injection. C, D, Representative maximum projection of confocal z-stack of MerTK iKO mice immunofluorescence in the mouse hippocampal DG at 1 d (C) and 4 weeks (D). Microglia were labeled with Iba1 (cyan) and apoptotic nuclei were detected by pyknosis/karyorrhexis (white, DAPI). E, F, Percentage of apoptotic cells engulfed (Ph index), weighted average of the percentage of microglia with phagocytic pouches (Ph capacity), apoptotic cells and microglia per septal hippocampus in MerTK iKO mice at 1 d (E) and 4 weeks (F). G, Representative confocal z-stack of MerTK iKO mice immunofluorescence in the mouse hippocampal DG at 1 d. Neuroblasts were labeled with DCX (green) and proliferation was detected with BrdU (magenta). H, Newborn cells (BrdU+) and newborn neuroblasts (DCX+, BrdU+) in MerTK iKO mice at 1 d post-BrdU. I, Neuroblasts (DCX+) in MerTK iKO mice at 1 d post-BrdU. J, Representative confocal z-stack of MerTK iKO mice immunofluorescence in the mouse hippocampal DG at 4 weeks post-BrdU. Neuroblasts were labeled with DCX (green), neurons were labeled with NeuN (magenta) and proliferation was labeled with BrdU (yellow). K, Newborn cells (BrdU+) and newborn neurons (NeuN+, BrdU+) in MerTK iKO mice at 4 weeks post-BrdU. L, BrdU+ yield was calculated as a ratio of the BrdU+ cells at 4 weeks over the average BrdU+ cells of each group at 1 d after injection. Scale bars: C, D, G, J, 50 μm (insets, 10 μm); C, D, z = 16.1 μm; G, z = 7 mm; J, z = 23.1 μm. N = 3 mice (E, H, I), N = 4–6 mice (F, K, L). Error bars represent mean ± SEM. #p = 0.096 (E), #p = 0.062 (F), *p < 0.05, **p < 0.01, ***p < 0.001 by Student's t test. Only significant effects are shown. Values of statistics used are shown in Table 3.

