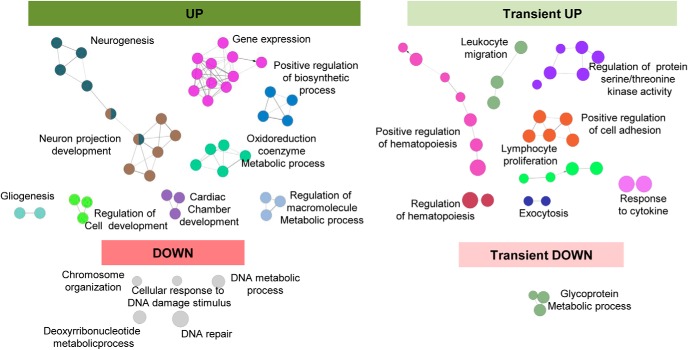
Figure 5.
Functional analysis of phagocytic microglia using ClueGO. Charts show the interactions among the significantly different functions for the four main expression patterns. Biological functions are visualized as colored nodes linked to related groups based on their κ score level. The node size reflects the enrichment significance of the term and functionally related groups are linked. Non-grouped terms are shown in gray.

