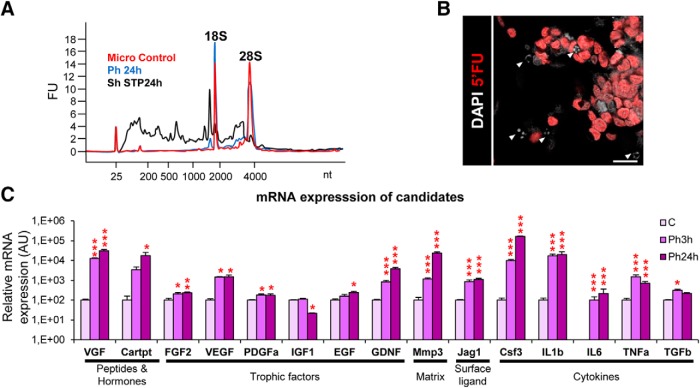
Figure 8.
Validation of transcriptional changes induced by phagocytosis. A, Electropherogram obtained by a bioanalyzer comparing the RNA profile (nt, nucleotides) of control and phagocytic microglia as well as apoptotic SH-SY5Y (treated with 3μM STP for 24 h). B, Representative confocal images of FU+ active transcription sites of SH-SY5Y cells treated with STP (3μM, 4 h) for apoptosis induction. Nuclei were labeled with DAPI (white), cell death was detected by pyknosis/karyorrhexis (white, DAPI; arrowheads), and transcription sites were detected by FU (red). C, mRNA expression levels of the candidates selected for validation by real-time qPCR. N = 4 independent experiments. HPRT was selected as a reference gene. Scale bar, 20 μm. N = 4 independent experiments (F). Error bars represent mean ± SEM. *p < 0.05, **p < 0.01, ***p < 0.001 by Holm–Sidak post hoc test of (after one-way ANOVA was significant at p < 0.05). Only significant effects are shown. Values of statistics used are shown in Table 4.

