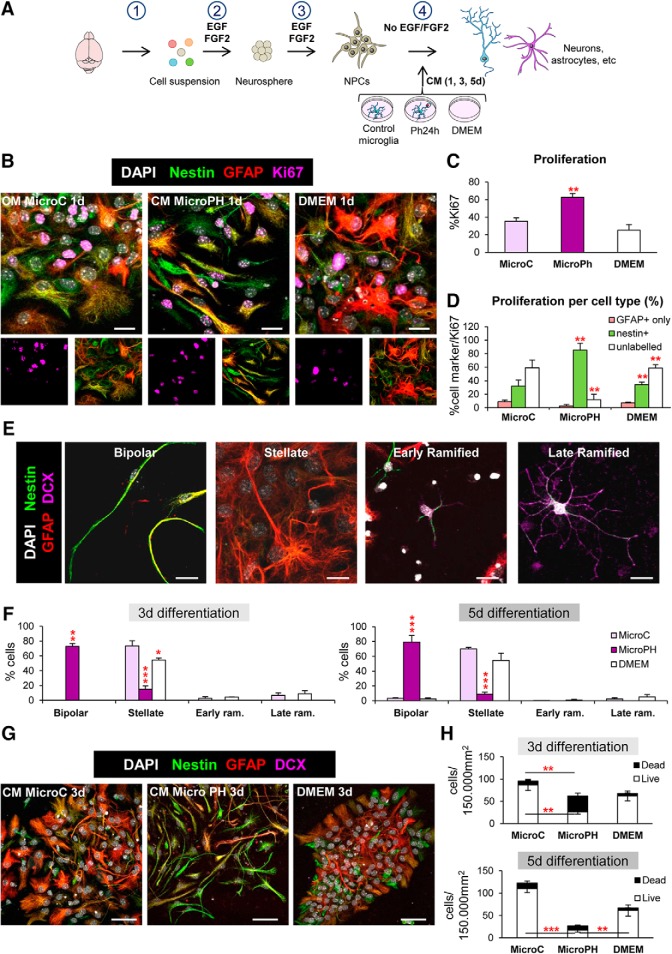
Figure 9.
Effect of phagocytic microglia secreted factors on neurogenesis in vitro. A, Experimental design of the in vitro neurogenesis assay: (1) brain disaggregation; (2) neurosphere proliferation; (3) dissociation, plating, and proliferation of NPCs for 48 h; (4) differentiation in the presence of conditioned media (CM) from control microglia (microC) or 24 h phagocytic microglia (microPh). B, Representative confocal microscopy images of NPCs treated with CM microC or microPH after 1 d. DMEM was used as control. C, Percentage of cells labeled with Ki67 over total cells labeled with DAPI. D, Percentage of different cell markers over total Ki67 population: nestin+ (with or without GFAP), GFAP only, or unlabeled. E, Representative confocal microscopy images of the different morphologies observed in the neurogenesis assay images. F, Percentage of the different cell types found after 3 and 5 d treatment with CM microC or microPH. Early/late ram refers to early/late ramified cells. G, Representative confocal microscopy images of NPCs treated with CM microC or microPH after 3 d. H, Density of live and dead cells (determined by pyknosis/karyorrhexis) after CM treatment for 3 and 5 d. Scale bars: B, 50 μm; E, 9 μm; B, z = 11.9 μm; G, z = 20 μm. N = 3 independent experiments (C, D, F, H). Error bars represent mean ± SEM. Two-way ANOVA (treatment × cell types, D) and three-way ANOVA (treatment × cell types × time, F; and treatment × life × time, H) showed interactions between the different factors and thus the data were split into several one-way ANOVAs. *p < 0.05, **p < 0.01, ***p < 0.001 by Holm–Sidak post hoc test versus MicroC group (after one-way ANOVA was significant at p < 0.05). Values of statistics used are shown in Table 5.

