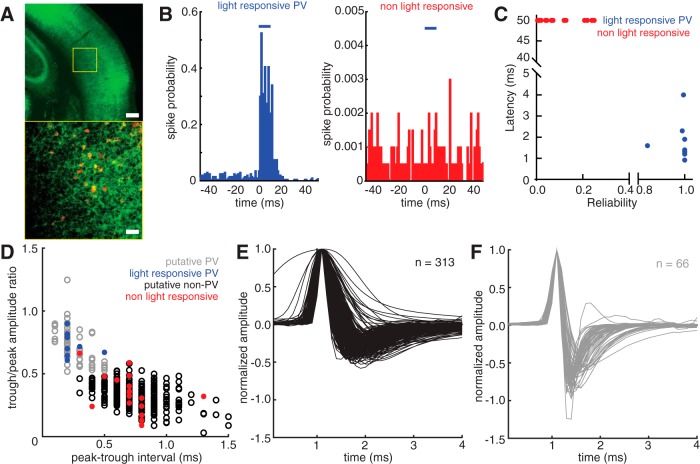
Figure 1.
Optogenetic identification of PV neurons during in vivo neuronal recordings from auditory cortex in awake, head-fixed mice. A, Photomicrographs taken at 4× (top) and 20× (bottom) of a section of the auditory cortex in an Ai32;PV-ires-Cre mouse expressing ChR2 in PV neurons. Green represents ChR2 fused to GFP. Top, Yellow box represents the location of the image in the bottom. Red represents PV. Scale bars: top, 200 μm; bottom, 50 μm. B, Representative example histograms of responses in a positively identified PV neuron (left) and a presumed non-PV neuron (right) to 10 ms light pulses (blue bars, 473 nm). Spike probability is computed as the number of spikes in each bin divided by the number of light trials. C, Scatterplot of the reliability of light responses (fraction of trials exhibiting spikes in response to light within the first 50 ms after light onset) versus the latency of spikes in response to light (n = 26). ChR2-expressing PV neurons (n = 9) are distinguished from non–ChR2-expressing presumed non-PV neurons (n = 17) by high reliability and low latency responses. D, Scatterplot of spike waveform features for all neurons reported in this study (n = 379). The quantities plotted are the time in milliseconds between the peak and the trough of the averaged waveform (see Materials and Methods) versus the ratio of the amplitudes of the trough and the peak of the averaged waveform. Blue and red points represent the light-responsive and light-nonresponsive neurons shown in C, respectively. Based on their locations in the scatterplot relative to the larger waveform dataset, the remaining neuronal waveforms were classified as pPV neurons (gray, n = 66) and putative non-PV neurons (black, n = 313). E, F, Plots of the averaged spike waveform from all putative non-PV (E) and pPV (F) neurons recorded for this study. Each waveform is aligned and normalized to its peak amplitude.

