Figure 3.
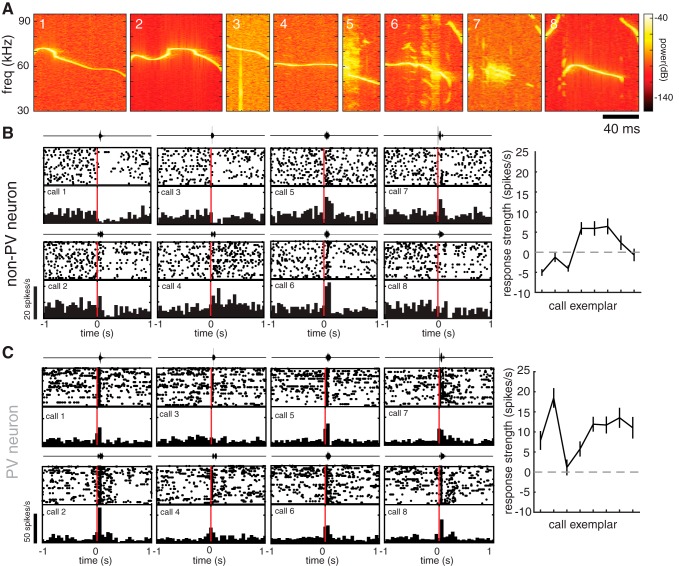
Individual auditory cortical neurons exhibit diverse responses to different pup call exemplars. A, Spectrograms of all call stimuli used in this study. B, C, Auditory responses of example non-PV (B) and pPV (C) neurons from naive WT females to a set of eight different pup call exemplars. Diverse responses to each of eight calls are depicted by a raster plot and PSTH (20 trials/call; bin size = 50 ms). Above each raster and PSTH is the oscillograph of the call played during those trials. Right, Tuning curve plotting the mean change in firing rate during the first 200 ms after call onset (response strength). The use of the term “tuning curve” is in this case not intended to imply systematic neighbor relationships between stimuli on the x axis.

