Figure 5.
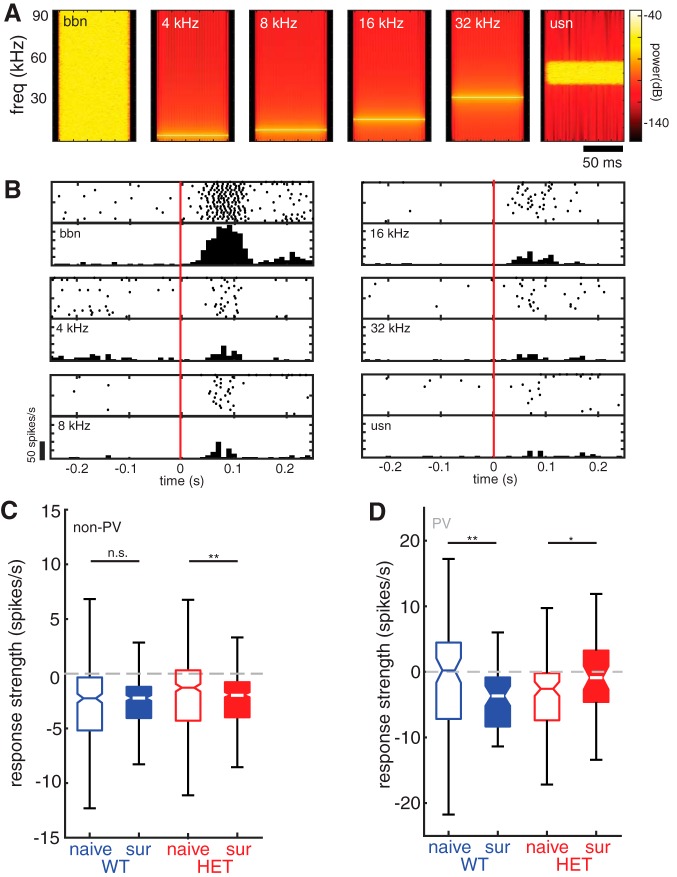
Maternal experience-dependent plasticity in WT females is stimulus-specific. A, Spectrograms of all tones and noise stimuli used in this study. B, Auditory responses of an example non-PV neuron from a naive WT female to each of the stimuli depicted in A. Responses to each of six stimuli are depicted by a raster plot and PSTH (20 trials/call; bin size = 10 ms). C, Boxplot of mean response strength to tones and noise stimuli for all non-PV cells comparing naive females with surrogate females for WT (blue; naive n = 342 cell-stimulus pairs and surrogate n = 288 cell-stimulus pairs) and HET (red; naive n = 432 cell-stimulus pairs and surrogate n = 462 cell- stimulus pairs) genotypes. Mann–Whitney U test with Holm–Bonferroni correction: n.s., Not significant, p = 0.84; **p = 0.002. D, Boxplot of mean response strength to tones and noise stimuli for all pPV cells comparing naive females with surrogate females for WT (blue; naive n = 96 cell-stimulus pairs and surrogate n = 60 cell-stimulus pairs) and HET (red; naive n = 108 cell-stimulus pairs and surrogate n = 48 cell-stimulus pairs) genotypes. Mann–Whitney U test with Holm–Bonferroni correction: **p = 0.002; *p = 0.032.

