Figure 8.
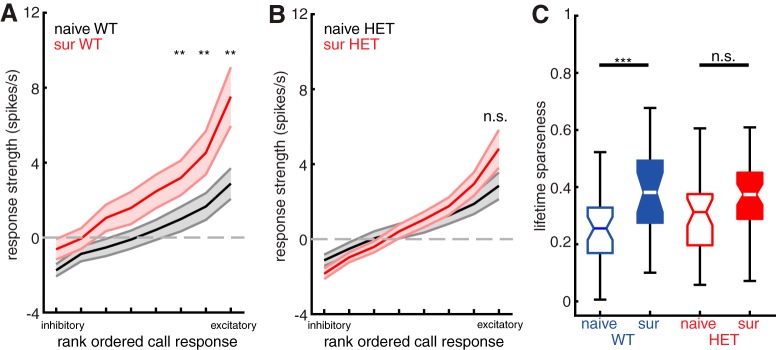
WT females show sharper tuning to calls in deep layer non-PV neurons after maternal experience, but HET females do not. A, Plot of mean sorted tuning curve for all deep layer non-PV neurons in WT females, comparing naive females (black) and surrogate females (red). Middle and outside lines indicate mean and SEM, respectively. Naive: n = 37 neurons; surrogate: n = 24 neurons. **p < 0.01 (Mann–Whitney U test with Holm–Bonferroni correction). B, Plot of mean sorted tuning curve for all deep layer non-PV neurons in HET females, comparing naive females (black) and surrogate females (red). Middle and outside lines indicate mean and SEM, respectively. Naive: n = 37 neurons; surrogate: n = 47 neurons. n.s., Not significant, p > 0.05 (Mann–Whitney U test with Holm–Bonferroni correction). C, Boxplot of mean lifetime sparseness computed for each tuning curve from all deep non-PV cells comparing naive females with surrogate females for WT (blue; naive n = 37 neurons and surrogate n = 24 neurons) and HET (red; naive n = 37 neurons and surrogate n = 47 neurons) genotypes. ***p < 0.001; n.s., Not significant, p = 0.06 (unpaired t test with Holm–Bonferroni correction).

