Figure 1.
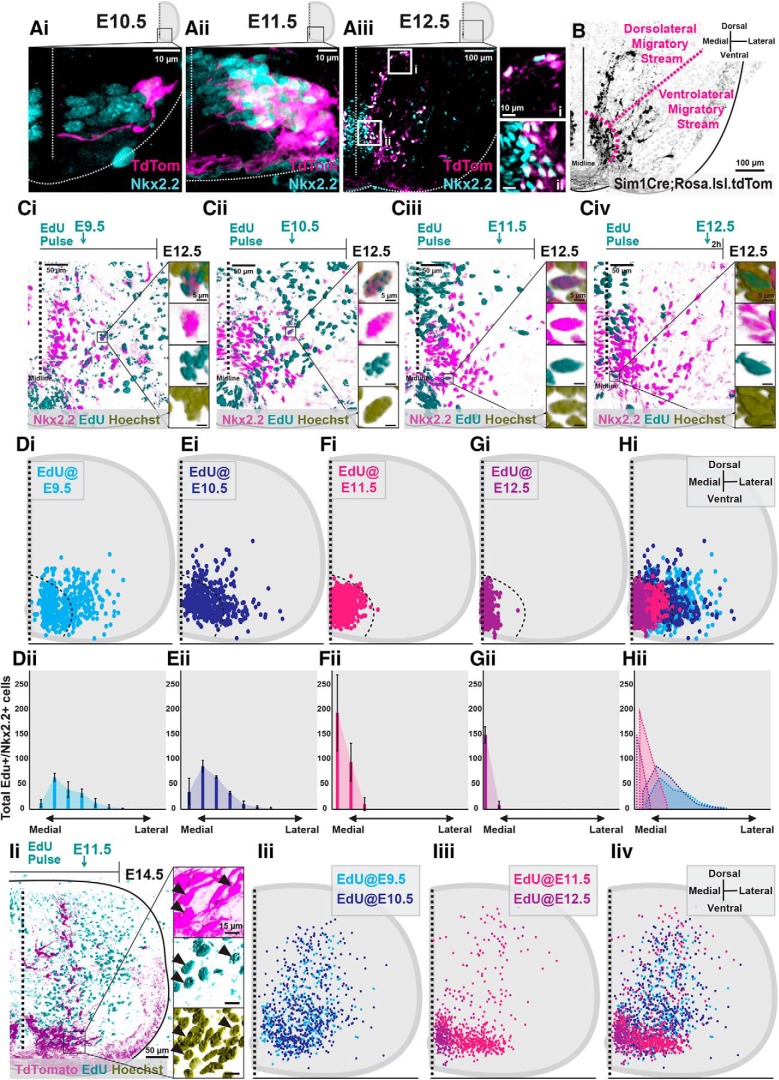
Neurogenesis timing orders postmitotic V3 INs into spatially and temporally distinct migratory streams. A, Representative images of Nkx2.2 immunoreactivity and TdTomato+ V3 INs from Sim1Cre;Rosa.lsl.tdTom mice at E10.5 (Ai), E11.5 (Aii), and E12.5 (Aiii). Scale bars: Aiii, i, 10 μm; Aiii, ii, 100 μm. B, Representative image of TdTomato+ V3 INs clustered within presumed dorsolateral and ventrolateral migratory streams at E12.5. Scale bar, 100 μm. C, Representative images of EdU pulses at E9.5 (Ci), E10.5 (Cii), E11.5 (Ciii), and E12.5 (Civ) and subsequent detection EdU+, Nkx2.2+, and Hoechst+ labeling at E12.5. Scale bars: 50 μm; inset, 5 μm. D–H, Hemicord EdU+/Nkx2.2+/Hoechst+ cell position plots (Di–Hi) and mediolateral cell count quantifications (Dii–Hii) at E12.5 from respective E9.5 (Di, Dii; n = 3 animals), E10.5 (Ei, Eii; n = 3 animals), E11.5 (Fi, Fii; n = 3 animals), and E12.5 (Gi, Gii; n = 3 animals) EdU pulse times. Hi, Hii, Combined EdU pulse times at E12.5 (n = 3 animals for each EdU pulse time). Ii, Representative image of EdU+/TdTomato+/Hoechst+ V3 INs at E14.5 pulsed with EdU at E11.5. Scale bars: Ii, 50 μm; inset, 15 μm). Iii–Iiv, E14.5 hemicord EdU+/TdTomato+ cell position plots of E9.5 and E10.5 early-born V3 (Iii, Iiv; n = 3 animals for each EdU pulse time) and E11.5 and E12.5 late-born V3 (Iiii, Iiv, n = 3 animals for each EdU pulse time).

