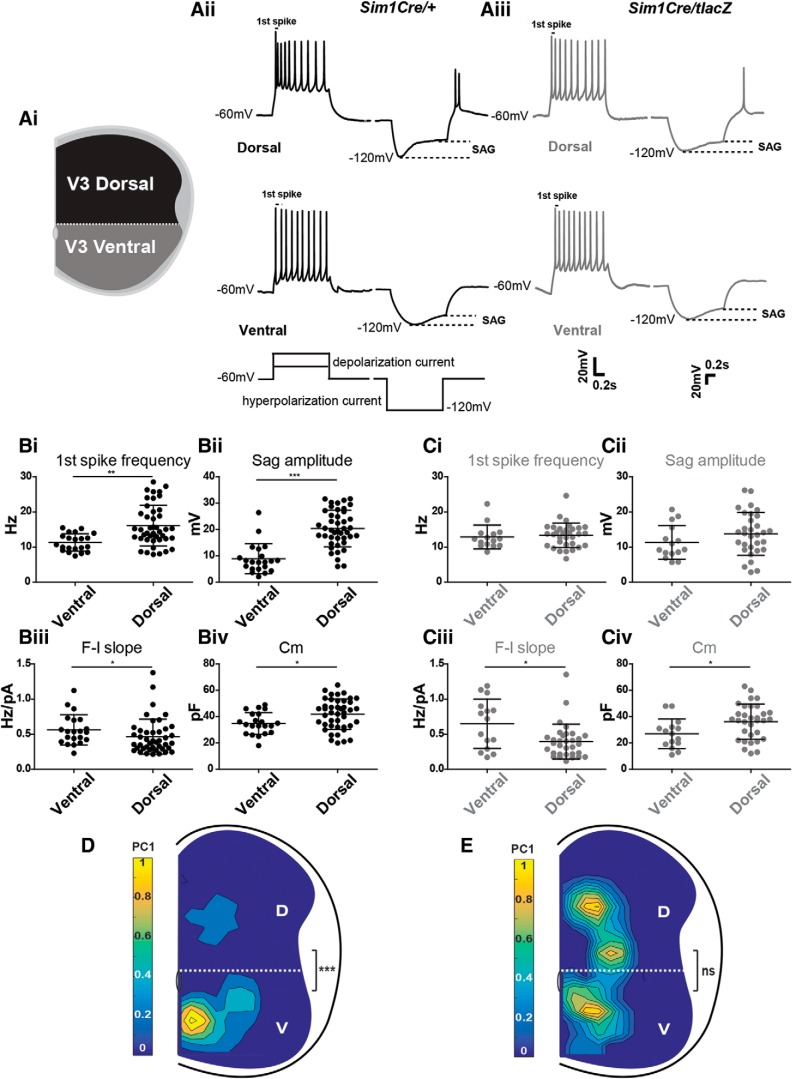
Figure 5.
Sim1 expression is essential for the electrophysiological diversification of dorsal V3 IN subsets in the higher lumbar spinal cord. Ai, Spatial criteria for recorded V3 INs as either dorsal or ventral. Aii, Aiii, Representative current-clamp traces from Sim1 control (Aii) and Sim1 knock-out (Aiii) V3d and V3v INs responding to 1 s suprathreshold (left) and subthreshold (right) 40 pA current injections. First-spike frequencies and sag voltages are indicated on traces. Bi–Civ, First-spike frequency (Bi, Ci), sag amplitude (Bii, Cii), F–I slope (Biii, Ciii), and Cm (Biv, Civ) comparisons between V3v and V3d V3 INs in Sim1 control (B) and knock-out mice (C; each point represents an individual cell; *p < 0.05, **p < 0.01, ***p < 0.001, two-tailed Mann–Whitney U test). Error bars, SD. D, E, Contour plots of V3 IN PC1 scores across the mediolateral and dorsoventral axis of higher lumbar (L1–L3) P0 Sim1 control (D) and Sim1 knock-out (E) spinal cords. Color bars indicate PC1 scores from high (yellow) to low (blue). Dashed lines indicate separation of V3d and V3v INs above and below the central canal, respectively. Statistical significance between PC1 scores of dorsal (D) and ventral (V) V3 INs in Sim1 control and KO mice was determined using the Kruskal–Wallis test (D, Sim1 control V3d, n = 25, V3v, n = 33, ***p < 0.001; E, Sim1 knock-out V3d, n = 23, V3v, n = 17; ns, p > 0.05).

