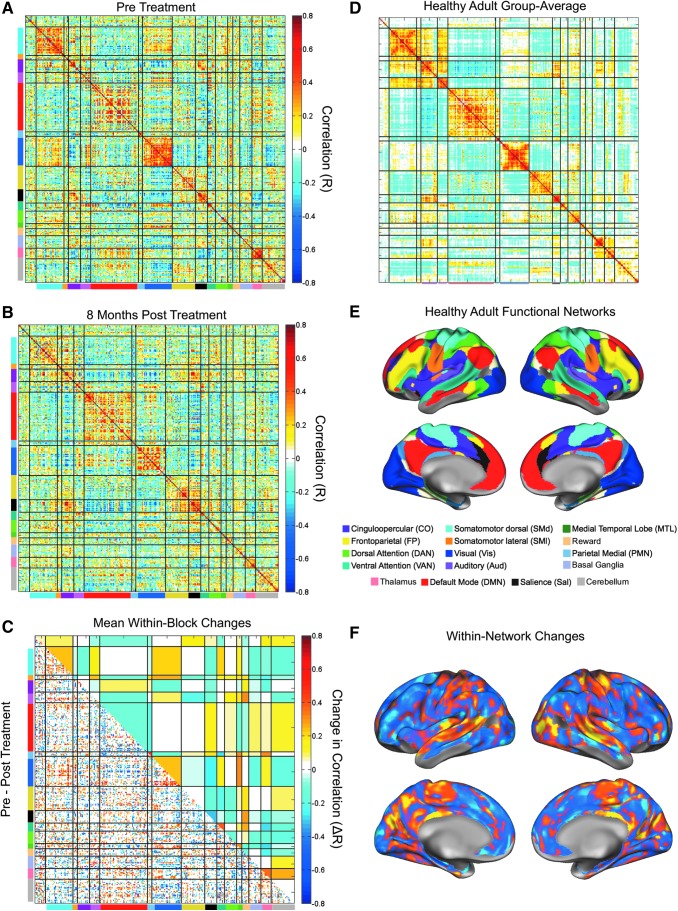
FIG. 3.
Substantial changes in functional network organization after whole-brain radiation therapy. Correlation matrices represent the patient's functional network organization pre-WBRT (A) and 8 months post-WBRT (B). Functional networks are color-coded as displayed on the brain shown in (E). The difference matrix was calculated as pre-WBRT minus post-WBRT, and a conservative null model was used to eliminate the effects of sampling variability. The bottom triangle of the matrix (C) shows correlation differences that survived the null model. The blue (pre<post) and yellow (pre>post) blocks in the upper triangle of the matrix in (C) represent mean network-wise (block-level) changes. The within-network changes from (C) are plotted on the brain in (F). For reference, the health adult group average from the Midnight Scan Club is shown in (D).

